Are blended trusts a recipe for smooth returns?
Kepler Trust Intelligence considers the performance of investment trusts blending styles including Scottish Mortgage, F&C, and City of London.
19th July 2024 14:01

This content is provided by Kepler Trust Intelligence, an investment trust focused website for private and professional investors. Kepler Trust Intelligence is a third-party supplier and not part of interactive investor. It is provided for information only and does not constitute a personal recommendation.
Material produced by Kepler Trust Intelligence should be considered a marketing communication, and is not independent research.
Over the past three years, trusts with blended approaches rather than a strong tilt to growth or value have been at or near the top of the pack across the developed equities sectors, benefiting from their flexibility in a period of extreme style gyrations.
With likely higher, more persistent interest rates and stickier inflation, we think the sustainability of growth and/or value strategies moving forward is uncertain. The end of near-zero interest rates and fluctuating inflation suggests that these factors might not drive markets as they have in the past.
- Invest with ii: Buy Investment Trusts | Top UK Shares | Open a Trading Account
We think balanced or flexible approaches could therefore provide investors a bridge between the two styles, offering diversification away from specific style biases, reducing volatility from style swings, or balancing style-heavy portfolios.
The great style rotation
From the early 2000s until around 2007 value performed well against growth, as shown by the yellow upward sloping line in the chart below that represents the cumulative returns of the value index against growth. However, after the financial crisis of the late 2000s, growth investing firmly established itself as the dominant investment style.
At times, it was consumer-facing stocks that led the market, but over the past five to eight years it has increasingly been technology stocks that have led the pack.
VALUE VERSUS GROWTH SINCE 2000
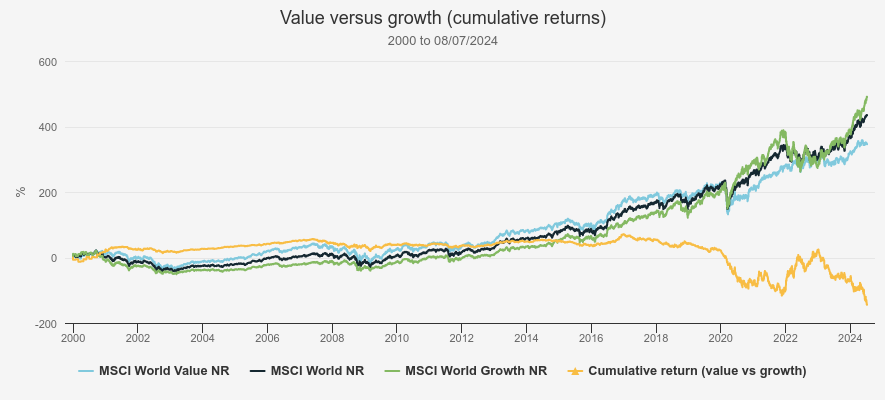
Source: Morningstar. Past performance is not a reliable indicator of future results
In fact, from 2007 until late 2020, value faced its longest period of underperformance versus growth since the Second World War. This was amplified in 2020, when value had its worst year in recorded history due to the pandemic-induced surge in growth sectors, which were boosted by the increased demand for online services, digital entertainment, and technology-enabling remote work. However, this environment, which had suited growth over most of the last 13 years, shifted significantly at the beginning of 2021, owing to the drastic changes in the global interest rate environment. It then shifted again in 2023, following falling inflation expectations and the increased chance of rate cuts.
Clearly there have been sharp gyrations of late, which have led to volatile swings in the performance of both value and growth strategies. To help illustrate these rotations more clearly, we’ve included a chart below that shows calendar year returns for global growth and value indices from 2021.
CALENDAR YEAR PERFORMANCE
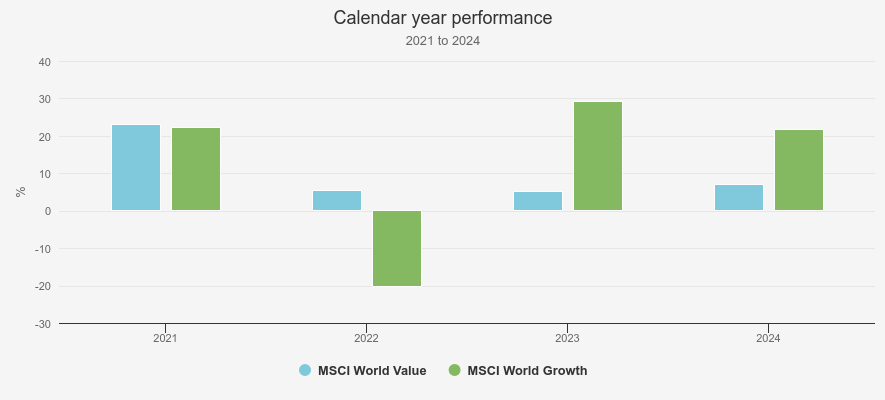
Source: Morningstar (2024 data point to 08/07/2024). Past performance is not a reliable indicator of future results
Based on the chart, it's evident that growth has outperformed value considerably over the last couple of years – which was in fact the last 18 months when you look more closely. However, when examining key developed market equity sectors, it isn’t so black and white. In the UK, a change in recessionary expectations, peaking interest rates and falling inflation has bolstered the performance and resilience of value plays. Japan is another example of this, where the consistency of pushing its corporate governance reforms, and its recent successes, have helped value outperform growth since 2021, with few signs of slowing.
In contrast, the US has been a little more mixed. A surge in technology trends, like artificial intelligence (AI), has propelled a lot of growth companies forward, benefitting a few investment trusts in the global and North America sector. However, growth companies not exposed to such trends continue to face challenges from inflation, geopolitical tensions in Europe and the Middle East, and uncertainties around the speed or frequency of interest rate cuts. Consequently, the performance from a number of other growth trusts in the global and North American sectors, hasn’t been as strong. In other words, the recent outperformance of growth versus value has been more complicated under the surface than it may seem, and much less evenly spread across sectors and geographies.
Style breakdown
As a result, trusts with a more balanced approach have fared well over the last three years, and in some cases, have outperformed growth-focused trusts. To help illustrate these examples, we’ve generated data from Morningstar (to end of June 2024) to provide a high-level indication of how each trust is stylistically split, based on its underlying holdings. We then consider the managers' investment processes to better understand, in practice, what their approach to style looks like and how it has impacted their performance in the market.
Europe
For longstanding European investors, it won’t come as a surprise to see a lack of ‘value’ offerings, given the dominance of growth investing over the years. Therefore, our expectations before running the data were that the table would be topped by growth-oriented strategies, especially given growth’s recent run. Surprisingly, this hasn’t been the case. Despite growth outperforming value at an index level in Europe over the last 18 months, strategies that have employed a more balanced approach have, overall, been more successful. As shown below, the investment trusts with the highest leaning to growth make up the bottom three of the table, underperforming those with a more balanced approach and the Europe index.
STYLE EXPOSURE OF EUROPEAN TRUSTS
| THREE-YEAR RETURN (%) (CUM FAIR NAV) | EQUITY STYLE VALUE (%) | EQUITY STYLE GROWTH (%) | EQUITY STYLE CORE (%) | |
| JPMorgan European Growth & Income Ord (LSE:JEGI) | 34.1 | 25.9 | 39.8 | 40.7 |
| Fidelity European Trust Ord (LSE:FEV) | 33.2 | 15.1 | 59.5 | 22.1 |
| Janus Henderson European Focus | 27.8 | 11.1 | 42.6 | 29.9 |
| European Opportunities Trust (LSE:EOT) | 16.7 | 2.2 | 75.1 | 31.1 |
| BlackRock Greater Europe Ord (LSE:BRGE) | 9.6 | 5.2 | 91.2 | 13.5 |
| Baillie Gifford European Growth Ord (LSE:BGEU) | -24.5 | 4.8 | 66.7 | 16.9 |
| Three-year total return | ||||
| MSCI Europe | 22.5 |
Source: Morningstar.
The strongest performing trust, in terms of NAV returns over three years, is JPMorgan European Growth & Income Ord (LSE:JEGI). JEGI provides investors a core European equity portfolio, which should consistently be at a lower valuation and have higher-quality characteristics than the benchmark, together with higher earnings momentum.
The managers focus on a business’s quality, including its profitability and sustainability of earnings; its value, by assessing if the market is incorrectly evaluating the business’s future prospects; and its momentum, focusing on whether a company is expected to report earnings higher than market consensus, which can create momentum behind share prices. By adopting a balanced approach that emphasises quality growth and valuation factors, JEGI has achieved solid returns, particularly when markets have been strong, but also showed resilience in periods of sharp rotations in style.
Global
In the global sector, the performance has been varied. For example, the trust demonstrating the highest tilt to growth, Manchester & London Ord (LSE:MNL), has topped the table. This trust's heavy investment in US technology stocks, particularly those benefiting from the AI surge such as NVIDIA Corp (NASDAQ:NVDA), Microsoft Corp (NASDAQ:MSFT), and Advanced Micro Devices Inc (NASDAQ:AMD), has significantly boosted returns, with these positions making up about 32%, 25%, and 7% of the portfolio, respectively.
On the other hand, Scottish Mortgage Ord (LSE:SMT), another heavyweight growth trust, has not fared as well recently. While SMT’s long-term performance has been robust, recent pressures from sticky inflation and persistently high interest rates have weighed on its high-growth companies, detracting from its performance over the last few years.
STYLE EXPOSURE OF GLOBAL TRUSTS
| THREE-YEAR RETURN (CUM FAIR NAV) | EQUITY STYLE VALUE % | EQUITY STYLE GROWTH % | EQUITY STYLE CORE % | |
| Manchester & London Ord (LSE:MNL) | 45.2 | 1.5 | 98.4 | 7.9 |
| Brunner Ord (LSE:BUT) | 34.6 | 21.2 | 45.3 | 27.7 |
| F&C Investment Trust Ord (LSE:FCIT) | 29.0 | 22.5 | 34.2 | 30.3 |
| AVI Global Trust Ord (LSE:AGT) | 28.0 | 8.4 | 24.2 | 35.9 |
| Alliance Trust Ord (LSE:ATST) | 27.7 | 22.6 | 47.1 | 33.1 |
| Bankers Ord (LSE:BNKR) | 18.2 | 21.9 | 36.4 | 45.8 |
| Witan Ord (LSE:WTAN) | 15.4 | 19.3 | 38.8 | 29.3 |
| Mid Wynd International Inv Tr Ord (LSE:MWY) | 11.3 | 0.0 | 55.9 | 42.4 |
| Martin Currie Global Portfolio Ord (LSE:MNP) | -1.9 | 0.0 | 80.4 | 22.1 |
| Monks Ord (LSE:MNKS) | -5.7 | 11.6 | 59.2 | 21.4 |
| Lindsell Train Ord (LSE:LTI) | -12.2 | 3.9 | 23.5 | 37.0 |
| Keystone Positive Change Investment Ord (LSE:KPC) | -20.7 | 8.8 | 66.0 | 15.7 |
| Scottish Mortgage Ord (LSE:SMT) | -28.2 | 1.9 | 54.9 | 10.0 |
| Three-year total return | ||||
| MSCI ACWI | 28.1 |
Source: Morningstar
Despite growth outperforming value globally, the results reflect broader economic pressures. Some high-growth companies have struggled with inflation and interest rate challenges, while others have thrived due to trends in AI and semiconductors. This divergence suggests that strategies focusing on companies facing economic pressures have likely seen performance challenges, while those investing in companies benefiting from technological trends have experienced performance boosts. In other words, the outperformance of growth over value over the past 18 months is to a large extent the outperformance of tech versus the market.
As a result, trusts with a more balanced style have also performed well, with some outperforming the index. Brunner Ord (LSE:BUT) and F&C Investment Trust Ord (LSE:FCIT) are notable examples. BUT aims to provide an all-weather portfolio of high-quality global equities, using a combination of quantitative and qualitative tools to assess company quality. This consistent focus on balancing quality, growth, and valuations has proven it capable of cutting through the short-term noise and performing across the market cycle.
Paul Niven, manager of FCIT, oversees the strategic and tactical asset allocations, leveraging the specialist stock-picking expertise from a range of what he considers best-in-class fund managers, within their respective styles. This multi-manager approach has led to a portfolio that is well-diversified and allows for tactical shifts in stylistic exposures that reflect his outlook. Paul’s focus on value and income over the past two financial years has been beneficial, although a lower allocation to the Magnificent Seven stocks has recently impacted performance. As such, reflecting a more positive outlook for equity markets and easing macroeconomic conditions, Paul has adjusted the portfolio by reducing some value exposure and increasing the growth tilt.
Alliance Trust Ord (LSE:ATST) has performed in line with the index and aims to provide investors with a well-balanced, core exposure to global equities, through a specialist, multi-manager strategy. The managers aim to maintain a stylistically neutral portfolio, and whilst style exposures range from high-growth to value-orientated strategies, each manager seeks to include high-quality companies with strong balance sheets. This is an approach that has led to robust returns over the period, despite the trust having a natural underweight to the large-cap tech stocks that have led the market. Additionally, Witan Ord (LSE:WTAN) plans to merge with ATST to form Alliance Witan, expected to be completed by early October 2024. We have written an update on this announcement recently, and believe the merger will strengthen the trust’s resources and enhance its ability to maintain a stylistically neutral portfolio capable of performing across market cycles.
Japan
Casting our eyes further east, we arrive at Japan. While its history is chequered, its stock market, notably the Nikkei 225, surpassed its 1989 highs in February this year. A large driver behind this has been Japan’s corporate governance reform push, something we’ve covered in detail in a previous note.
The reforms aim to enhance the standards of listed Japanese companies, with particular emphasis on those showcasing low corporate value, poor growth prospects, and capital inefficiency. Many investors consider these companies to be the more traditional Japanese value stocks and unlike the other geographies we’ve covered so far, value in Japan has outperformed growth since 2021. Consequently, growth trusts have performed poorly, being outshone by those with more exposure to value.
STYLE EXPOSURE OF JAPAN TRUSTS
| THREE-YEAR RETURN (CUM FAIR NAV) | EQUITY STYLE VALUE % | EQUITY STYLE GROWTH % | EQUITY STYLE CORE % | |
| CC Japan Income & Growth Ord (LSE:CCJI) | 45.3 | 21.1 | 35.7 | 40.0 |
| Schroder Japan Trust Ord (LSE:SJG) | 29.6 | 24.8 | 31.1 | 55.0 |
| JPMorgan Japanese Ord (LSE:JFJ) | -9.5 | 7.8 | 71.7 | 34.1 |
| Baillie Gifford Japan Ord (LSE:BGFD) | -16.6 | 16.2 | 46.2 | 37.0 |
| Fidelity Japan Trust Ord (LSE:FJV) | -17.9 | 15.5 | 38.8 | 28.8 |
| Three-year total return | ||||
| TOPIX | 17.3 |
Source: Morningstar
When we look beneath the bonnet, we would argue the strategies that have performed the best are better classified as balanced. The managers behind both CC Japan Income & Growth Ord (LSE:CCJI) and Schroder Japan Trust Ord (LSE:SJG) focus on quality businesses that have attractive growth characteristics but are also undervalued by the market, essentially blending aspects from both styles. CCJI also focuses heavily on providing shareholders an income, which would, on the surface at least, place it in the ‘value’ camp. However, CCJI has demonstrated the ability over time to provide an attractive income profile without compromising on the quality of its underlying holdings or their long-term growth potential, meaning it is better positioned as a balanced or core strategy.
North America
Naturally, the US market makes up a significant portion of the investment opportunities within this sector, a market that’s well-represented in the growth-oriented sectors, such as technology. Like the global sector above, a lot of the North American trusts invest in high-growth businesses, some that have been at the whim of inflationary and interest rate pressures and others that have welcomed the surge in semiconductor and AI companies.
The top-performing trust is the heavyweight growth player Pershing Square Holdings Ord GBP (LSE:PSH) (no Morningstar data available). However, the weakest trust over the last three years has been Baillie Gifford US Growth Ord (LSE:USA), which, despite some exposure to AI players, has struggled with inflationary and rate pressures. That said, its performance has picked up recently as US inflation has started to come down, potentially signalling a looming rate cut.
Despite mixed growth results, the more balanced and value-tilted approaches have shown resilience within this sector. JPMorgan American Ord (LSE:JAM) stands out for its strong outperformance of the index. The strategy is to combine two portfolios: the best ideas from a growth manager and a value manager. Each is asked to provide between ten and twenty of their best stock picks, resulting in a concentrated pool of best ideas across the two strategies. However, the portfolio is balanced between the two styles, with no particular bias toward either value or growth. Additionally, both managers emphasise quality factors as an approach that has buoyed performance over the period.
STYLE EXPOSURE OF NORTH AMERICAN TRUSTS
| THREE-YEAR RETURN (CUM FAIR NAV) | EQUITY STYLE VALUE % | EQUITY STYLE GROWTH % | EQUITY STYLE CORE % | |
| Pershing Square Holdings Ord (EURONEXT:PSH) | 58.2 | N/A | N/A | N/A |
| JPMorgan American Ord (LSE:JAM) | 50.5 | 23.2 | 45.7 | 35.0 |
| North American Income Trust Ord (LSE:NAIT) | 25.1 | 48.0 | 2.8 | 52.8 |
| BlackRock Sustainable American Income (LSE:BRSA) | 24.0 | 48.6 | 11.2 | 39.8 |
| Canadian General Investments Ord GBP (LSE:CGI) | 14.7 | 21.1 | 59.6 | 26.2 |
| Middlefield Canadian Income Ord (LSE:MCT) | 7.4 | 47.2 | 2.3 | 55.4 |
| Baillie Gifford US Growth Ord (LSE:USA) | -33.0 | 1.6 | 55.7 | 7.4 |
| Three-year total return | ||||
| S&P 500 | 45.5 |
Source: Morningstar
UK
The UK is currently perceived as cheap, home to out-of-favour, downtrodden sectors that have struggled over the last decade. It is weighted towards the more value-oriented sectors, like banking and energy, which have failed to keep pace with the rapid growth of technology stocks over the years. Reviewing the data from the last three years to the end of June 2024, trusts with more balanced approaches and those leaning towards value have performed well.
Temple Bar Ord (LSE:TMPL), is one of the most value-tilted strategies across the sector, meaning it has benefitted from UK value outperforming UK growth this year. City of London Ord (LSE:CTY) also leans a little towards value and has performed well over the period. That said, manager Job Curtis isn’t a pure value player. He emphasises companies with robust balance sheets capable of sustainable cash generation and good growth potential, alongside attractive valuations, as he thinks it supports both dividend and future capital growth, contributing to the trust's resilience and impressive dividend track record over time.
STYLE EXPOSURE OF UK TRUSTS
| THREE-YEAR RETURN (CUM FAIR NAV) | EQUITY STYLE VALUE % | EQUITY STYLE GROWTH % | EQUITY STYLE CORE % | RANKING | |
| Edinburgh Investment Ord (LSE:EDIN) | 36.0 | 22.0 | 38.2 | 36.1 | 1 |
| Temple Bar Ord (LSE:TMPL) | 33.9 | 72.3 | 7.5 | 16.2 | 2 |
| City of London Ord (LSE:CTY) | 29.9 | 55.5 | 16.4 | 31.7 | 3 |
| Merchants Trust Ord (LSE:MRCH) | 29.4 | 64.6 | 3.8 | 40.8 | 4 |
| Law Debenture Corporation Ord (LSE:LWDB) | 29.2 | 48.1 | 20.6 | 30.0 | 5 |
| BlackRock Income and Growth Ord (LSE:BRIG) | 21.3 | 38.3 | 31.6 | 31.0 | 6 |
| Murray Income Trust Ord (LSE:MUT) | 15.7 | 33.8 | 37.3 | 39.6 | 11 |
| Three-year total return | |||||
| FTSE All-Share | 23.9 |
Source: Morningstar
However, Edinburgh Investment Ord (LSE:EDIN) tops the table and has benefited from its balanced style over this period. EDIN underwent a change in management in March 2020, where the portfolio was revamped to focus on a growth-at-a-reasonable-price (GARP) approach, which blends elements of growth and value. EDIN’s new manager, Imran Sattar, came on board this year, and much like his predecessors, echoes this focus, preferring to invest in both growth and value companies as well as those with latent recovery potential. This multi-style and flexible process is designed to reduce the volatility of returns through the economic and market cycle, and has resulted in sector-leading performance over the last three years.
We decided to merge both the UK All Companies sector and UK Equity Income sector together, which left us with a large list of UK trusts. For the sake of keeping the data readable, we selected the top five, to keep things consistent for readers, but also highlighted a few trusts of interest further down the list. As we can see from looking at the four trusts following EDIN in the table above, each strategy is titled to value, a pattern followed by most others in the UK peer group.
BlackRock Income and Growth Ord (LSE:BRIG) and Murray Income Trust Ord (LSE:MUT), on the other hand, place an emphasis on balancing quality, income and valuation, adopting more of a blended strategy when investing in the UK, quite different from most peers.
Adam Avigdori of BRIG prefers to stay style-agnostic, meaning the portfolio is not strongly tilted to either growth or value, but a balance of the two. He argues that markets have shifted into ‘goldilocks’ territory, which, in this context of slowing and in cases falling inflation, has signalled the peak for interest rates and certain broad macroeconomic indicators are not expected to deteriorate further. He argues that within this environment, his focus on investing in quality companies that are cash generative, have good growth prospects and sit at reasonable valuations, which in our view demonstrates blending aspects of both styles, could be better placed to drive returns over the long term. Consequently, he argues that purely style-focused strategies might not continue to drive markets as they have in the past.
Charles Luke and Iain Pyle, managers of MUT, echo the belief on quality, arguing it allows them to blend the most appealing aspects of both growth and value strategies. This leads them to target companies with good-quality characteristics, including strong business models, robust balance sheets, and compelling ESG characteristics, as well as seeking out businesses with attractive income profiles, given that dividend yield acts as a valuation backstop. They also believe that a focus on high-quality companies demonstrating these traits offers fewer tail risks and a greater margin of safety, which in turn can lead to less volatile and more resilient earnings streams over time.
By emphasising quality, income, and valuation, both BRIG and MUT aim to navigate market uncertainties and provide stable, long-term returns to shareholders.
So, what’s next?
‘What’s next?’ is an exceedingly difficult question to answer, akin to predicting the future, so Germany’s oracle octopus, Paul, would have certainly come in handy. We think the volatility of style drivers in recent years might find investors considering investment trusts that can adapt to diverse economic conditions by blending growth and value strategies. Additionally, we think it is really tech that has been driving markets higher in the past two years rather than growth, and trusts with a more balanced stylistic approach are doing well.
These approaches have demonstrated resilience and potential for stable returns, which we think positions them as viable options in today's dynamic environment. Steadily falling interest rates and controlled inflation could foster more stable economic growth but would keep some discipline via funding costs, and in our view, this would benefit quality companies which are bought at a reasonable price.
However, more dramatic outcomes are possible. In scenarios where interest rates trend towards zero, growth investing could thrive. Cheaper borrowing could fuel investments in technology and innovation, potentially boosting corporate revenues through increased consumer spending.
Conversely, in a scenario of persistently high rates and inflation, traditional value sectors like banks may benefit. Higher rates offer attractive returns on lower-risk investments, appealing to cautious investors seeking stable income. We think another reason to favour managers with a balanced approach is defensive: protecting against the possibility of one of these damaging scenarios.
Kepler Partners is a third-party supplier and not part of interactive investor. Neither Kepler Partners or interactive investor will be responsible for any losses that may be incurred as a result of a trading idea.
These articles are provided for information purposes only. Occasionally, an opinion about whether to buy or sell a specific investment may be provided by third parties. The content is not intended to be a personal recommendation to buy or sell any financial instrument or product, or to adopt any investment strategy as it is not provided based on an assessment of your investing knowledge and experience, your financial situation or your investment objectives. The value of your investments, and the income derived from them, may go down as well as up. You may not get back all the money that you invest. The investments referred to in this article may not be suitable for all investors, and if in doubt, an investor should seek advice from a qualified investment adviser.
Full performance can be found on the company or index summary page on the interactive investor website. Simply click on the company's or index name highlighted in the article.
Important Information
Kepler Partners is not authorised to make recommendations to Retail Clients. This report is based on factual information only, and is solely for information purposes only and any views contained in it must not be construed as investment or tax advice or a recommendation to buy, sell or take any action in relation to any investment.
This report has been issued by Kepler Partners LLP solely for information purposes only and the views contained in it must not be construed as investment or tax advice or a recommendation to buy, sell or take any action in relation to any investment. If you are unclear about any of the information on this website or its suitability for you, please contact your financial or tax adviser, or an independent financial or tax adviser before making any investment or financial decisions.
The information provided on this website is not intended for distribution to, or use by, any person or entity in any jurisdiction or country where such distribution or use would be contrary to law or regulation or which would subject Kepler Partners LLP to any registration requirement within such jurisdiction or country. Persons who access this information are required to inform themselves and to comply with any such restrictions. In particular, this website is exclusively for non-US Persons. The information in this website is not for distribution to and does not constitute an offer to sell or the solicitation of any offer to buy any securities in the United States of America to or for the benefit of US Persons.
This is a marketing document, should be considered non-independent research and is subject to the rules in COBS 12.3 relating to such research. It has not been prepared in accordance with legal requirements designed to promote the independence of investment research.
No representation or warranty, express or implied, is given by any person as to the accuracy or completeness of the information and no responsibility or liability is accepted for the accuracy or sufficiency of any of the information, for any errors, omissions or misstatements, negligent or otherwise. Any views and opinions, whilst given in good faith, are subject to change without notice.
This is not an official confirmation of terms and is not to be taken as advice to take any action in relation to any investment mentioned herein. Any prices or quotations contained herein are indicative only.
Kepler Partners LLP (including its partners, employees and representatives) or a connected person may have positions in or options on the securities detailed in this report, and may buy, sell or offer to purchase or sell such securities from time to time, but will at all times be subject to restrictions imposed by the firm's internal rules. A copy of the firm's conflict of interest policy is available on request.
Past performance is not necessarily a guide to the future. The value of investments can fall as well as rise and you may get back less than you invested when you decide to sell your investments. It is strongly recommended that Independent financial advice should be taken before entering into any financial transaction.
PLEASE SEE ALSO OUR TERMS AND CONDITIONS
Kepler Partners LLP is a limited liability partnership registered in England and Wales at 9/10 Savile Row, London W1S 3PF with registered number OC334771.
Kepler Partners LLP is authorised and regulated by the Financial Conduct Authority.
Editor's Picks