eyeQ: the critical driver of Tesla’s share price
interactive investor has teamed up with the experts at eyeQ who use artificial intelligence and their own smart machine to analyse macro conditions and generate actionable trading signals. This time it analyses the electric vehicle giant.
3rd July 2024 10:20
Huw Roberts from eyeQ

"Our signals are crafted through macro-valuation, trend analysis, and meticulous back-testing. This combination ensures a comprehensive evaluation of an asset's value, market conditions, and historical performance." eyeQ
- Discover: eyeQ analysis explained | eyeQ: our smart machine in action | Glossary
Tesla
Trading signal: long-term strategic model
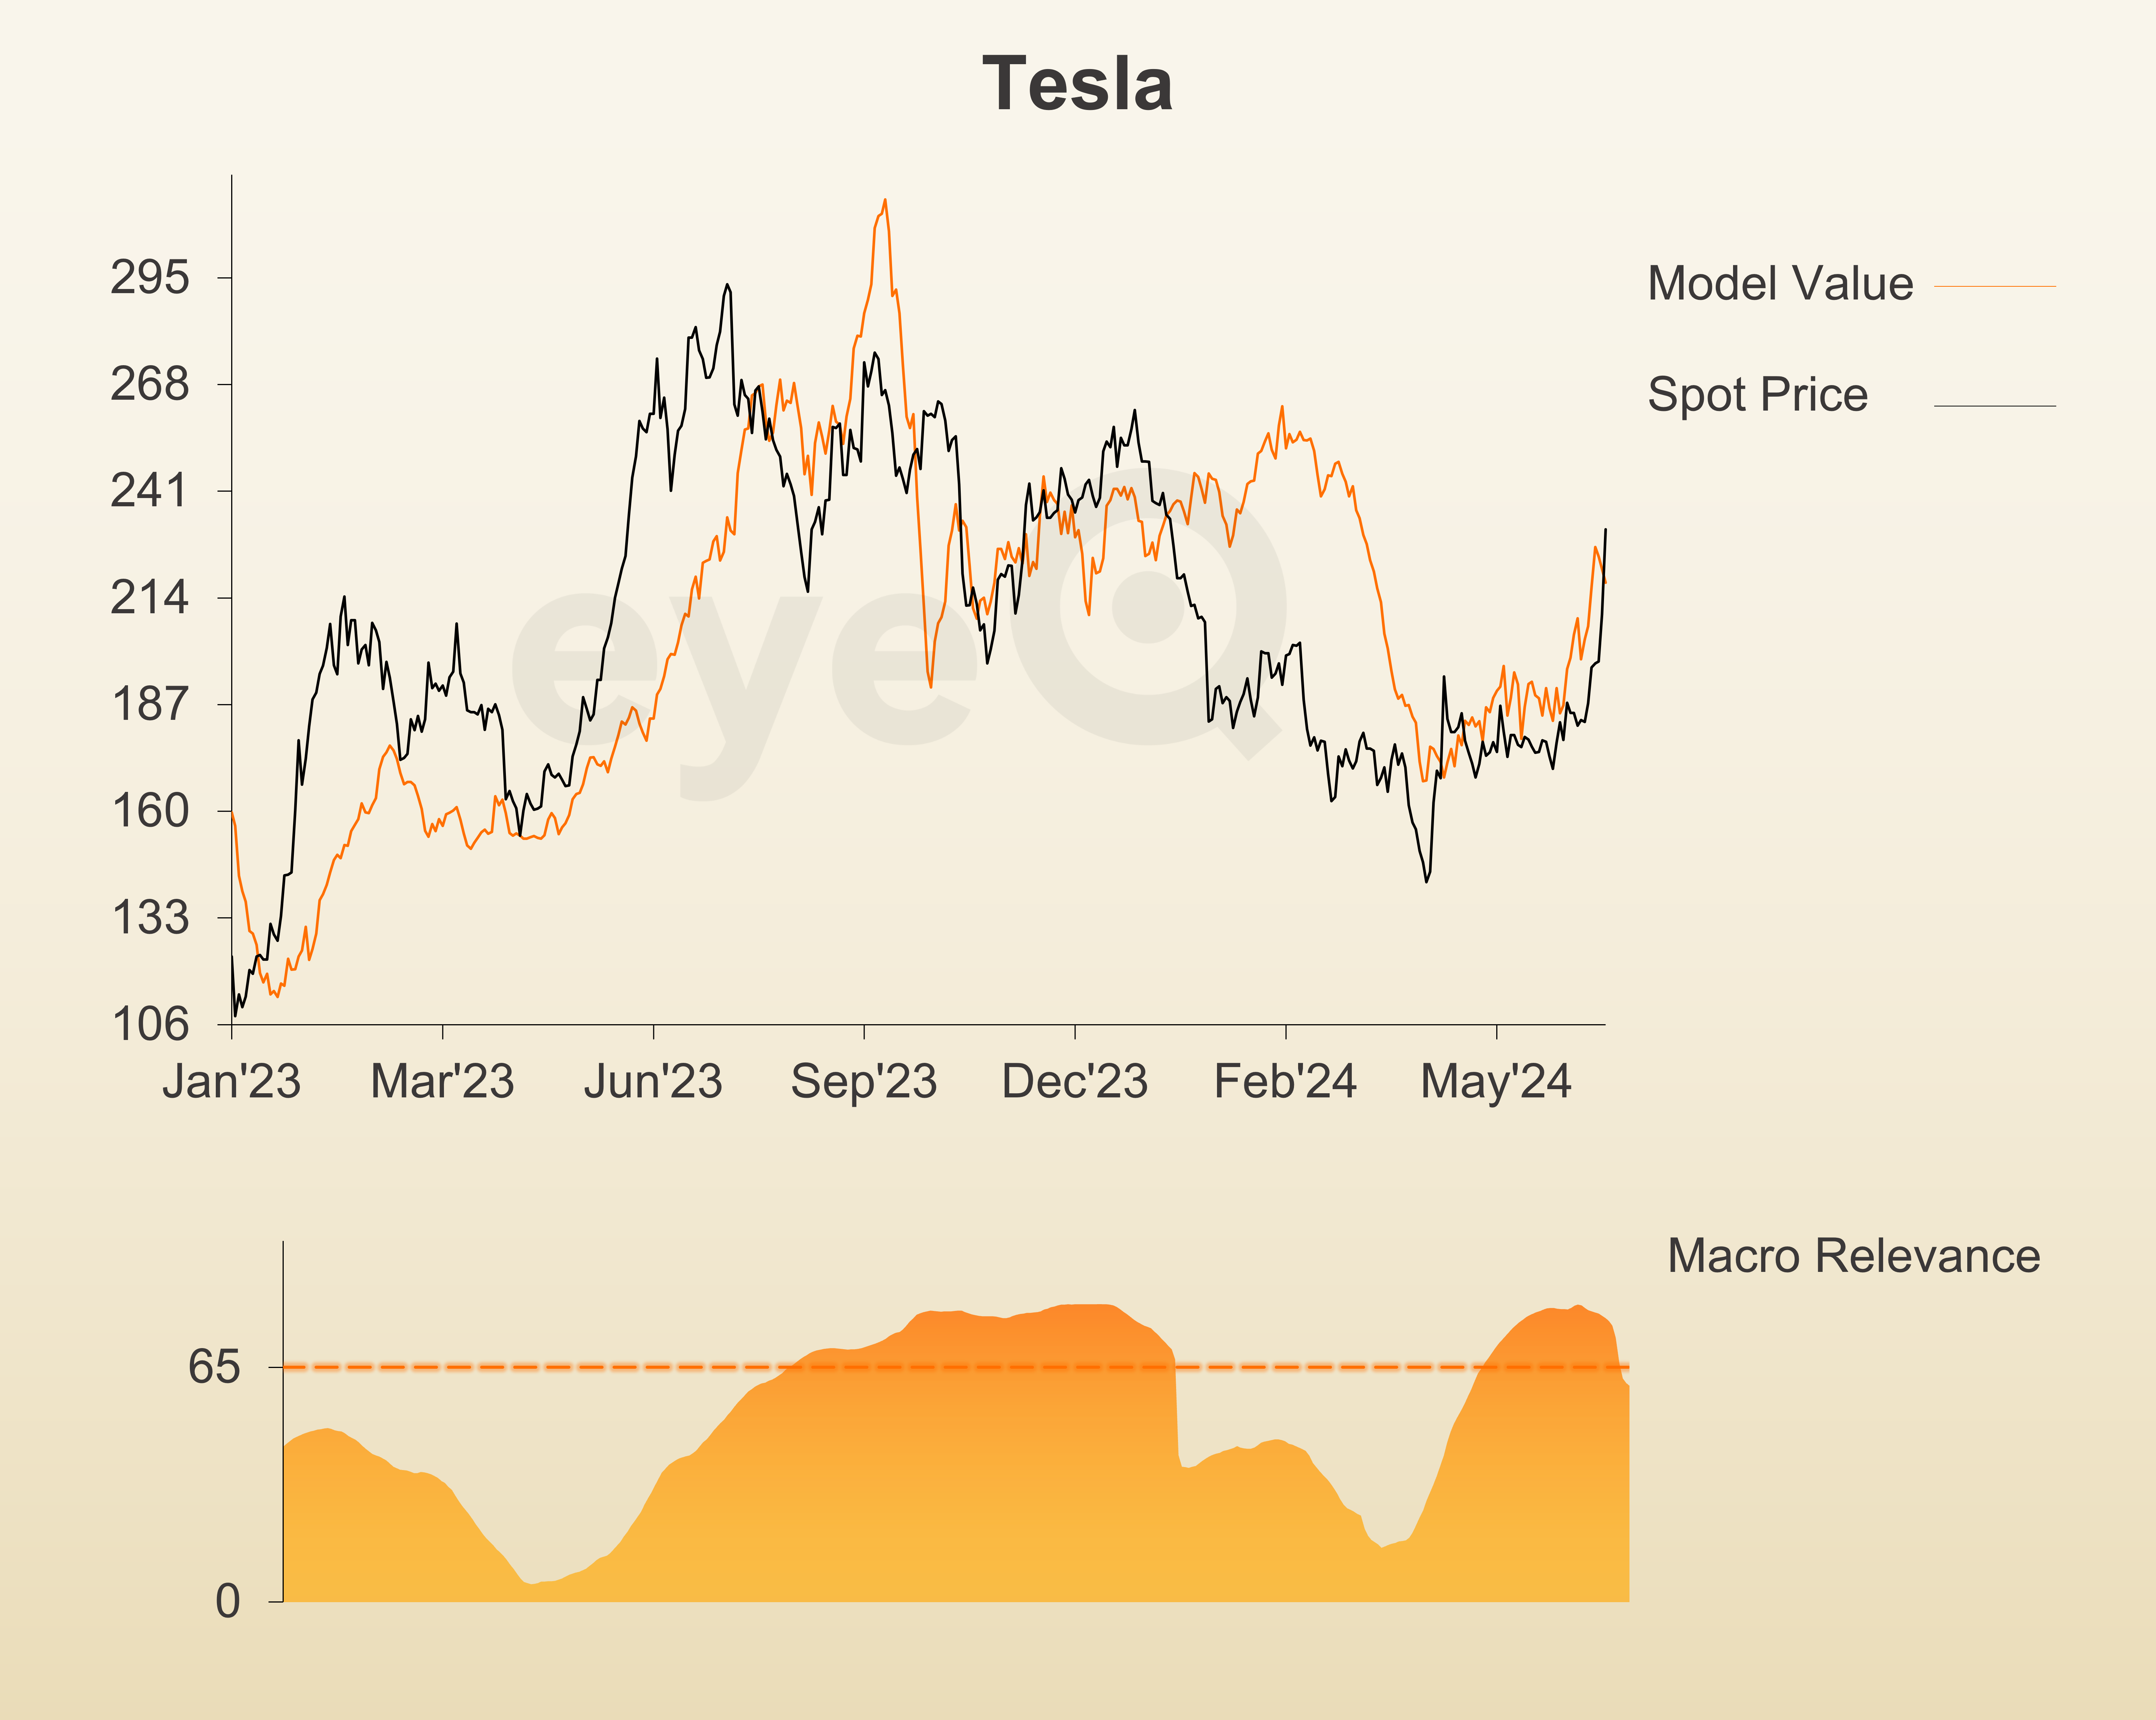
Model value: $217.75
Fair Value Gap: +5.84% premium to model value
Model relevance: 60%
Data correct as at 3 July 2024. Please click glossary for explanation of terms.
UK financial markets appear to be drifting, treading water ahead of the general election. So, while we wait, we re-visit a favourite stock among retail investors, Tesla Inc (NASDAQ:TSLA).
There are a couple of interesting observations from eyeQ’s perspective.
- Macro relevance has just fallen back under our 65% threshold. Big picture things such as growth, inflation and the Federal Reserve had been key to understanding shifts in the stock price for much of the second quarter. But now something else has become the critical driver.
Earlier this week, the stock rose above its 200-day Moving Average with accelerating volume. Yesterday, after sales fell, but not by as much as expected, Tesla stock jumped to its highest level since early January. Again, volume was big – second only to NVIDIA Corp (NASDAQ:NVDA). These are signs chartists always love; it could be that technical analysis is the dominant story right now.
- Macro momentum has been rising. Our model value bottomed at $167.55 on 19 April, pre-empting the 2024 low in Tesla’s share price three days later on the 22nd. And model value has risen 30% since then. After initially lagging, the stock has also rallied and caught up with the improvement in macro conditions.
- Finally, Tesla has some nice defensive characteristics right now. That’s not at all obvious from a fundamental viewpoint; Tesla is typically regarded as a speculative investment bet. But, from a macro perspective, the current patterns show the stock is fine with slower economic growth, falling inflation, stress in credit markets and volatility in bond markets.
Tesla as a comparative safe haven is not an argument you’d ordinarily read. And falling macro relevance does mean there’s a health warning on eyeQ’s model. Still, the improvement in model value is noticeable and the charts are becoming constructive.
Source: eyeQ. Past performance is not a guide to future performance.
Useful terminology:
Model value
Where our smart machine calculates that any stock market index, single stock or exchange-traded fund (ETF) should be priced (the fair value) given the overall macroeconomic environment.
Model (macro) relevance
How confident we are in the model value. The higher the number the better! Above 65% means the macro environment is critical, so any valuation signals carry strong weight. Below 65%, we deem that something other than macro is driving the price.
Fair Value Gap (FVG)
The difference between our model value (fair value) and where the price currently is. A positive Fair Value Gap means the security is above the model value, which we refer to as “rich”. A negative FVG means that it's cheap. The bigger the FVG, the bigger the dislocation and therefore a better entry level for trades.
Long Term model
This model looks at share prices over the last 12 months, captures the company’s relationship with growth, inflation, currency shifts, central bank policy etc and calculates our key results - model value, model relevance, Fair Value Gap.
These third-party research articles are provided by eyeQ (Quant Insight). interactive investor does not make any representation as to the completeness, accuracy or timeliness of the information provided, nor do we accept any liability for any losses, costs, liabilities or expenses that may arise directly or indirectly from your use of, or reliance on, the information (except where we have acted negligently, fraudulently or in wilful default in relation to the production or distribution of the information).
The value of your investments may go down as well as up. You may not get back all the money that you invest.
Equity research is provided for information purposes only. Neither eyeQ (Quant Insight) nor interactive investor have considered your personal circumstances, and the information provided should not be considered a personal recommendation. If you are in any doubt as to the action you should take, please consult an authorised financial adviser.
Disclosure
We use a combination of fundamental and technical analysis in forming our view as to the valuation and prospects of an investment. Where relevant we have set out those particular matters we think are important in the above article, but further detail can be found here.
Please note that our article on this investment should not be considered to be a regular publication.
Details of all recommendations issued by ii during the previous 12-month period can be found here.
ii adheres to a strict code of conduct. Contributors may hold shares or have other interests in companies included in these portfolios, which could create a conflict of interests. Contributors intending to write about any financial instruments in which they have an interest are required to disclose such interest to ii and in the article itself. ii will at all times consider whether such interest impairs the objectivity of the recommendation.
In addition, individuals involved in the production of investment articles are subject to a personal account dealing restriction, which prevents them from placing a transaction in the specified instrument(s) for a period before and for five working days after such publication. This is to avoid personal interests conflicting with the interests of the recipients of those investment articles.
Editor's Picks