Five positives for your portfolio and three trust tips
The outlook for global equities is still good, thanks largely to the strength of the US market, argues Kepler’s Thomas McMahon.
6th September 2024 14:01

This content is provided by Kepler Trust Intelligence, an investment trust focused website for private and professional investors. Kepler Trust Intelligence is a third-party supplier and not part of interactive investor. It is provided for information only and does not constitute a personal recommendation.
Material produced by Kepler Trust Intelligence should be considered a marketing communication, and is not independent research.
Investors love cliches. One of the phrases that is bandied about again and again is “climbing the wall of worry”. It is used to describe a market that advances despite endless chatter about issues that could or should derail it. Perhaps it could be considered the normal state of affairs, as it is rare for there not to be some fear that is stalking markets. Yet if we had been intimidated by those worries, we would not have enjoyed the strong market returns seen over the past 12 months.
- Invest with ii: Buy Investment Trusts | Top UK Shares | ISA vs SIPP
Thinking back to late last year, there was not a lot of optimism around at all, yet the S&P 500 is up 24% in dollar terms over one year, at the time of writing, or 20% in sterling. This has helped drive the MSCI ACWI up 17.5% in GBP. Naturally, there is still so much to worry about!
Here we argue that the outlook for global equities is still good, thanks largely to the strength of the US market, taking in turn five of the biggest worries we hear from investors.
1) Interest rate cuts aren’t a sign of a crashing economy
Are interest rate cuts good for equities? Surely there is no debate. Rates go down, valuations go up, right? Sadly, reality is a little more complicated, as the chart below illustrates. It shows US interest rates and the S&P 500 over the past 10 years. We can isolate two episodes of rate cuts: in those innocent days of mid-2019, and then in the panic of early 2020 as toilet paper and profitless start-ups flew off the shelves.
The first episode saw equities move sideways, although they then saw a leg up after the cuts had been absorbed—possibly a lagged effect of the cuts. The second episode was accompanied by a huge sell-off followed by a huge recovery, which as we know was felt disproportionately in certain sectors. It took six months for the index to regain its previous high, and more like nine months before it decisively broke through.
US INTEREST RATES VS US EQUITIES
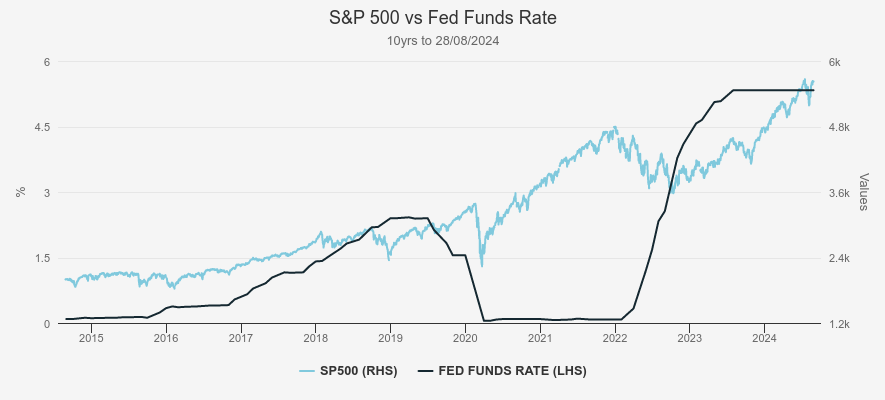
Source: St Louis FRED. Past performance is not a reliable indicator of future results
One lesson is that we need to consider why rates are being cut to have a view on whether they will be accompanied by a rising or falling market. Rate cuts are usually a response to economic weakness, and the question then becomes how much of that economic weakness is in the price, i.e. how well have market participants seen the extent of the weakness that is to come.
In 2019, a trade war between the US and China was threatening to weigh on growth and employment, although there is no evidence of it coming through in the unemployment rate. In 2020, by contrast, the pandemic came from nowhere and rate cuts were an emergency response to a situation nobody knew the extent or ramifications of.
Evidently, we are closer to scenario one at the current moment. Jerome Powell has cited a slight deterioration in the employment situation as signalling it is time for monetary policy to adjust. Yet while employment indicators have been weak, GDP growth remains healthy, and inflation is still marginally above target. The likelihood that the Fed is “behind the curve” looks relatively low, and there is no evidence that rates being hiked so suddenly and kept high for so long has caused a disastrous impact on the US economy.
A similar fear was prevalent about the UK economy over 2022 and 2023, but notably this storyline seems to have been dropped. Economies that are gently growing and seeing modest rate cuts, seem to us, to be a recipe for equities to do well.
2. This isn’t the dot-com bubble v2
In fact, assuming data doesn’t rapidly deteriorate, it could well be the earnings of the largest tech companies are more important as to whether markets rise over the coming months. Last week, NVIDIA Corp (NASDAQ:NVDA)’s earnings saw a mixed reception, with the shares falling up to 9% in after-hours trading before making most of that back at the open. This could be seen as a bad omen. The really scary thought is that NVIDIA and other AI-related stocks might be in a bubble which will burst like the dot-com bubble of 1999-2000.
It’s important, though, to disentangle a few factors influencing the behaviour of NVIDIA’s stock. First, we should acknowledge that it is far and away the most traded stock out there, with investors leveraged to the gills on both sides. One piece of evidence is open interest, or the number of open option contracts on the stock. As of the date of the last earnings report, it was higher for NVIDIA than the next five US stocks combined. In fact, it was three times higher than the second-placed stock, Tesla Inc (NASDAQ:TSLA). Apple Inc (NASDAQ:AAPL) is 20% larger in market-cap terms, yet open interest in its shares is 4.4x smaller. Volatility in NVIDIA’s share price is extreme as a result, and we shouldn’t read too much into the daily moves.
We then need to consider fundamentals. Lots of press commentary focuses on the share price moves without really relating it to earnings. It is easy to see big percentages such as the 165% NVIDIA has risen in 2024, or the 2,900% it has risen over five years, and stop there. Investors might worry that moves like this simply have to be unwarranted. Coupled with the high P/Es bandied about for NVIDIA, an alarming picture can be painted. But when a simple P/E is quoted, it is usually historical and there are two major flaws with looking at this figure. First, it is inherently misleading when earnings growth is high. Trailing 12-month P/Es look at the last four quarters, but NVIDIA’s latest earnings are 150% higher than they were 12 months ago. This isn’t a seasonal effect, but a structural uptick in demand. As such, the earnings used in a traditional railing 12-month P/E is too low. A better way to approach it would be to annualise the latest quarter. As of the time of writing, this would see NVIDIA’s P/E fall from 74x to 40x (as of 30 August 2024). Still high, but much less scary.
But there is a more fundamental problem with a historical P/E: you don’t buy historical earnings when you buy a stock, you buy a share of future earnings. Ideally, to value a company you forecast growth a number of years into the future and discount the cash flows back to a present value. At the very least, we should be looking at what earnings are likely to be in the next year or so and sticking to a multiple on those. Based on FactSet consensus expectations, NVIDIA’s earnings for the 2026 calendar year should be around 18% higher than for 2025. This would see the company’s forward P/E fall to 34x. This compares to 33x for Amazon.com Inc (NASDAQ:AMZN), another great company, but not one expected to see the growth of NVIDIA over the coming years. Now, of course, these expectations could be wrong, but NVIDIA has beaten analyst expectations in each quarter for five years. And the most salient conclusion is that even if the price of NVIDIA is wrong, it is not mad, and not indicative of a bubble. The huge percentage moves of the past few years are irrelevant to whether the price is justified, which is all about the future. In fact, it would need a dramatic slowing of expenditure on AI by large-cap tech to see a serious pullback in NVIDIA, in our view.
We are not equity analysts here, let alone tech-sector specialists, however, that isn’t going to stop us from expressing an opinion on whether that is likely (where would the fun be in that?). Klarna announced results last week in which it reported a huge boost to profits thanks to cutting staff and using AI. Amazon’s CEO, Andy Jassy, has detailed the incredible time savings the company has made in upgrading its software using AI to develop the code. In our view, company after company is going to look to do the same sort of thing. It is easy to be cynical about new tech and see the downsides, but despite social media being an absolute hellhole with endless negative social consequences, from mental health problems in adolescents to extremism in politics, it is a cash-generating machine. Perusing the historic earnings growth of chief trash-seller Meta makes the point. AI will be the same in our view. We should remember that the technology is still young, and will undoubtedly improve and evolve, just as social media has. Whether NVIDIA’s shares are fairly valued or a little expensive, we think it is clear this is not a bubble, and there is still plenty of money to be made in the years to come in AI and in companies utilising it.
3. You haven’t missed the boat
We have suggested that NVIDIA’s valuation is not indicative of bubble behaviour. In fact, if we look across the US market as a whole, valuations also look reasonable. Looking at a forward P/E based on next year’s consensus earnings, valuations are still around the middle of the range. It is currently circa 21x, below the 10-year average of circa 24x. We think it is much more relevant to look at the S&P 500 versus its own history rather than versus international comparators, as these metrics need to be considered in the light of growth expectations. For example, while the UK market has a forward P/E of just 12x, according to Yardeni Research, earnings growth in 2025 is forecast to be 8.5% versus 15.4% for the US. This suggests to us that the US market is not overvalued.
4. The developed markets aren’t becoming emerging markets
One of the troubling effects of social media is that it has encouraged lurid and extreme political rhetoric on all sides. We would suggest that if Donald Trump is elected in November, a lot of people on both sides will be quick to forget their predictions of Emperor Trump sweeping aside the Senate to end American democracy.
Relatedly, it is interesting how quickly the “UK is an emerging market” claims have been dropped over the past year or so. Trump will probably cut taxes, throw a few scraps to the cultural right and try to get Europe to spend more on defence, just like last time. He will spend a lot of time playing golf (apparently he’s really quite good) and telling assorted leaders around the world how great he is. The left will probably protest the election as they always do, and there will be zero arrests for “insurrection”, as usual. The US will remain a great place to invest, whether Kamala Harris beats Trump or not.
Analysis by T Rowe Price of S&P 500 performance around US elections is slightly troubling though. They find that returns are generally lower in the 12 months after an election than long-term averages. Returns are generally higher before elections too. However, crucially, they note that in 54% of the events, the US has seen a recession in the 12 months following an election, which we suggest is the real reason for this poorer performance. So, the real risk factor in our view is the US economy, not its politics. This brings us back to our first point above: as long as the US economy continues its gentle weakening and doesn’t slip into a significant recession, the outlook for markets looks good.
5. China isn’t falling apart
No man is an island, and no country can keep the world economy ticking on its own. The US tech sector does give its market some significant non-cyclical earnings drivers, but slowdowns in the world’s other large economies will have a major impact on US corporate earnings and, therefore, markets. China is still the third-largest customer of US goods and services. Indeed, China is still a major customer for NVIDIA. Even if the most sophisticated chips can’t be exported into China, NVIDIA is still forecast to make $12 billion in chip sales to the country this year, more than the company’s total sales in all lines of business in 2023.
This is an interesting example because this sales growth has been achieved while China’s GDP growth has averaged around 5%, down from its pre-pandemic trend. Over the same period, China has become the largest automobile exporter in the world, overtaking Japan. This is thanks partly to its expertise in electric vehicles, which is creating a headache for Europe in particular, thanks to China’s ability to sell these vehicles for a lot less. However, the vast bulk of its exports are still ICE vehicles, and here China is seeing huge growth in sales to Asia, the Middle East, and Africa.
So, while Chinese GDP growth has slowed, it remains attractively high versus its global competitors, and US sanctions have not prevented the country from developing industry in high-value-added areas and growing trade around the world. Absent any remarkably ill-advised attempt to invade Taiwan, it doesn’t look likely that a collapse of the Chinese economy is on the cards.
Conclusion
Investing is a difficult game, as a number of behavioural and psychological biases come into play and make it hard to see the wood for the trees. Whether you are more motivated by fear of missing out or fear of buying at the top may well be a matter of psychological type. We think looking at the earnings picture in the US provides a more objective basis for confidence in its market, in particular for the tech sector. We would be inclined to stay invested and be positive about the outlook.
In particular, we think the outlook is positive for Allianz Technology Trust Ord (LSE:ATT) and other tech-heavy trusts. Its shares are up 35% over 12 months, ahead of a NAV TR of 29.8%. Yet they still trade on a 9% discount, perhaps evidence that some investors failed to even attempt the ascent of the wall of worry.
For investors who want broader market exposure, Brunner Ord (LSE:BUT) is also riding the crest of a wave. It has performed in line with the MSCI ACWI over the past year, returning 17.5% in NAV terms and more in share price terms, despite having a large underweight to the US. What it does have in the US is tech, with Microsoft Corp (NASDAQ:MSFT), Taiwan Semiconductor Manufacturing Co Ltd ADR (NYSE:TSM), and ASML Holding NV (EURONEXT:ASML) among the holdings in the 22% of the portfolio in this sector, but no NVIDIA.
For investors who are more sceptical about the parts of the market that have rallied the most, it could be an interesting option. Similarly, Alliance Trust Ord (LSE:ATST), shortly to become Alliance Witan if a proposed combination is approved, could fit the same bill. ATST keeps its sector, country, and factor weights close to the index and the managers seek to outperform by pure stock selection. It owns NVIDIA, albeit less than its weight in global indices, and has around 24% in technology. On balance, we think the risks of not being invested outweigh the risks of being invested at this time, particularly for long-term investors.
Kepler Partners is a third-party supplier and not part of interactive investor. Neither Kepler Partners or interactive investor will be responsible for any losses that may be incurred as a result of a trading idea.
These articles are provided for information purposes only. Occasionally, an opinion about whether to buy or sell a specific investment may be provided by third parties. The content is not intended to be a personal recommendation to buy or sell any financial instrument or product, or to adopt any investment strategy as it is not provided based on an assessment of your investing knowledge and experience, your financial situation or your investment objectives. The value of your investments, and the income derived from them, may go down as well as up. You may not get back all the money that you invest. The investments referred to in this article may not be suitable for all investors, and if in doubt, an investor should seek advice from a qualified investment adviser.
Full performance can be found on the company or index summary page on the interactive investor website. Simply click on the company's or index name highlighted in the article.
Important Information
Kepler Partners is not authorised to make recommendations to Retail Clients. This report is based on factual information only, and is solely for information purposes only and any views contained in it must not be construed as investment or tax advice or a recommendation to buy, sell or take any action in relation to any investment.
This report has been issued by Kepler Partners LLP solely for information purposes only and the views contained in it must not be construed as investment or tax advice or a recommendation to buy, sell or take any action in relation to any investment. If you are unclear about any of the information on this website or its suitability for you, please contact your financial or tax adviser, or an independent financial or tax adviser before making any investment or financial decisions.
The information provided on this website is not intended for distribution to, or use by, any person or entity in any jurisdiction or country where such distribution or use would be contrary to law or regulation or which would subject Kepler Partners LLP to any registration requirement within such jurisdiction or country. Persons who access this information are required to inform themselves and to comply with any such restrictions. In particular, this website is exclusively for non-US Persons. The information in this website is not for distribution to and does not constitute an offer to sell or the solicitation of any offer to buy any securities in the United States of America to or for the benefit of US Persons.
This is a marketing document, should be considered non-independent research and is subject to the rules in COBS 12.3 relating to such research. It has not been prepared in accordance with legal requirements designed to promote the independence of investment research.
No representation or warranty, express or implied, is given by any person as to the accuracy or completeness of the information and no responsibility or liability is accepted for the accuracy or sufficiency of any of the information, for any errors, omissions or misstatements, negligent or otherwise. Any views and opinions, whilst given in good faith, are subject to change without notice.
This is not an official confirmation of terms and is not to be taken as advice to take any action in relation to any investment mentioned herein. Any prices or quotations contained herein are indicative only.
Kepler Partners LLP (including its partners, employees and representatives) or a connected person may have positions in or options on the securities detailed in this report, and may buy, sell or offer to purchase or sell such securities from time to time, but will at all times be subject to restrictions imposed by the firm's internal rules. A copy of the firm's conflict of interest policy is available on request.
Past performance is not necessarily a guide to the future. The value of investments can fall as well as rise and you may get back less than you invested when you decide to sell your investments. It is strongly recommended that Independent financial advice should be taken before entering into any financial transaction.
PLEASE SEE ALSO OUR TERMS AND CONDITIONS
Kepler Partners LLP is a limited liability partnership registered in England and Wales at 9/10 Savile Row, London W1S 3PF with registered number OC334771.
Kepler Partners LLP is authorised and regulated by the Financial Conduct Authority.
Editor's Picks