Has Barclays rebound got further to run?
After a swift and complete recovery from the tariff crash, this high street bank has fresh multi-year highs in its sights. Independent analyst Alistair Strang has run his software to generate new targets.
12th May 2025 07:12
Somehow or other, we’ve managed to duck reporting on Barclays (LSE:BARC) for five weeks. In the intervening period, the bank suffered a dramatic drop down to the 223p level! This share price reversal to (and below) our projected 256p was certainly brief and dramatic, and now the market appears to be trying to convince everyone a closing price 241p was a real bottom.
- Invest with ii: Open a Stocks & Shares ISA | Top ISA Funds | Transfer your ISA to ii
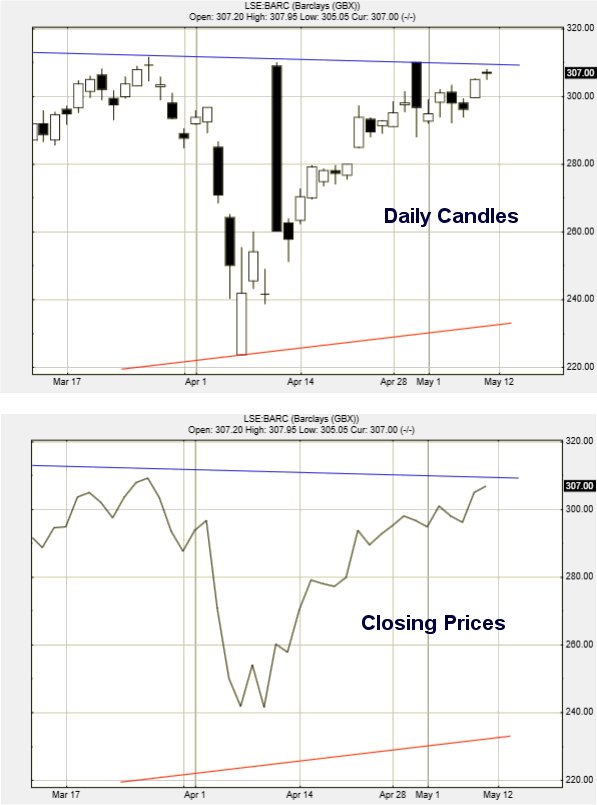
There’s certainly something exceedingly strange going on with Barclays' share price, as can be seen from the two charts below, one showing candles which express the range of each day's movements, the other showing closing prices.
Source: Trends and Targets. Past performance is not a guide to future performance.
At a glance, it appears the market has declared a closing price of 223p on this, something which is completely invisible when just viewing candles in an attempt to understand price movements. This is why we often bang on about how important it can be to review the point at which a share price closed a session and, in the case of Barclays, it makes incredible visual sense.
Of equal importance are the daily highs within the period, confirming quite brutally there’s a tend line (Blue) which the market is carefully avoiding. Logically, we feel it safe to assume any closure above Blue (ideally 309p) shall present an image where we can dare assume Barclays' share price is heading upward properly.
If choosing to play safe and embrace sanity, above the previous high which defined the Blue downtrend will be intraday movement above 316p which, by our standards, defines a higher high and makes a long position a viable option.
Obviously, this is still playing a little dangerous as we’re suggesting a scenario which allows for safer intraday trading. In the case of Barclays, above 316p now calculates with an initial target of 366p with our secondary, if beaten, working out at a more useful 408p. Essentially, closure above 309p should enter a cycle where a longer term 500p becomes the ruling attraction for the share.
Obviously, for a retail bank, such an ambition is quite an attractive proposition.
If things intend to go wrong, below 284p risks becoming troublesome, introducing a scenario which gives the potential of reversals to an initial 268p with our secondary, if broken, at 244p and hopefully a rebound. Surprisingly, in this instance, we can present a third level drop target if 244p breaks at 206p and a potential bottom.
Amazingly, this rather neatly matches the lows of mid-2024, presenting a perfect point for a bounce in the future. At present, absolutely nothing suggests this reversal cycle as it’s only a potential.
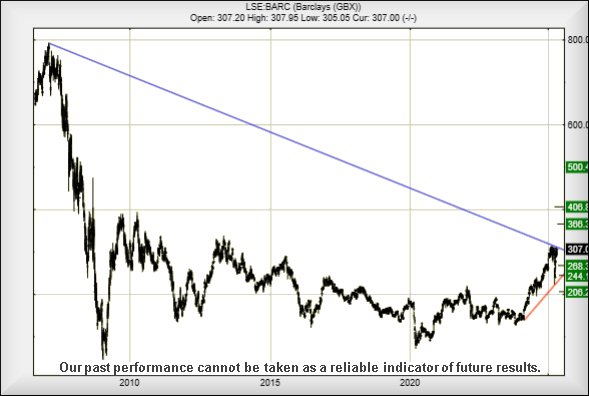
Source: Trends and Targets. Past performance is not a guide to future performance.
Alistair Strang has led high-profile and "top secret" software projects since the late 1970s and won the original John Logie Baird Award for inventors and innovators. After the financial crash, he wanted to know "how it worked" with a view to mimicking existing trading formulas and predicting what was coming next. His results speak for themselves as he continually refines the methodology.
Alistair Strang is a freelance contributor and not a direct employee of Interactive Investor. All correspondence is with Alistair Strang, who for these purposes is deemed a third-party supplier. Buying, selling and investing in shares is not without risk. Market and company movement will affect your performance and you may get back less than you invest. Neither Alistair Strang or Interactive Investor will be responsible for any losses that may be incurred as a result of following a trading idea.
These articles are provided for information purposes only. Occasionally, an opinion about whether to buy or sell a specific investment may be provided by third parties. The content is not intended to be a personal recommendation to buy or sell any financial instrument or product, or to adopt any investment strategy as it is not provided based on an assessment of your investing knowledge and experience, your financial situation or your investment objectives. The value of your investments, and the income derived from them, may go down as well as up. You may not get back all the money that you invest. The investments referred to in this article may not be suitable for all investors, and if in doubt, an investor should seek advice from a qualified investment adviser.
Full performance can be found on the company or index summary page on the interactive investor website. Simply click on the company's or index name highlighted in the article.
Editor's Picks