Stockwatch: is this a sure-fire UK recession indicator?
Analyst Edmond Jackson worries about the risk of a “debt doom loop” that depresses economic activity, but this stock is still a buy. Another is proving remarkably resilient.
29th July 2025 12:17

How literally should we take the latest Red Flag Alert report from insolvency practitioner Begbies Traynor Group (LSE:BEG) - citing that the number of businesses in critical financial distress is up 21.4% in the second quarter on a like-for-like basis. Is this a sure-fire UK recession indicator?
- Invest with ii: Open a Stocks & Shares ISA | ISA Investment Ideas | Transfer a Stocks & Shares ISA
While I see parallels with at least one company I have commented on just recently, a separate one I regard very much as a “consumer discretionary cyclical” simultaneously issued a first-half update that counters Begbies’ claims. It also appears to affirm how a large segment of the UK population is enjoying pay rises that at least match inflation, although it’s unclear whether that is a lagging indicator, and if in six months’ time negotiations will be tougher.
Such macro variables are axiomatic to whether profit warnings accelerate, but I would stay keenly alert to them.
Affirms second-quarter downturn in businesses I’ve covered
Advertisers such as WPP (LSE:WPP) and recruiter PageGroup (LSE:PAGE) are classic cyclical businesses, lately suffering. So is ceramics manufacturer Churchill China (LSE:CHH) which is linked to the higher-end hospitality trade.
Begbies counts 49,309 businesses in critical financial distress in the second quarter of 2025, an 8.6% increase on the first quarter, which broadly tallies with why I picked up on these company warnings. Moreover, Begbies asserts all 22 of the sectors covered by its Red Flag Alert report are experiencing a year-on-year increase in critical financial distress “as economic pressures impacted every corner of the economy”.
Without being complacent, I think we should bear in mind this includes smaller private firms that are indeed more sensitive, versus substantive listed companies. That said, an aggregate adverse change is ultimately going to affect all corporate confidence and capacity to invest; likewise, individuals to spend on goods and services.
The worst-affected sectors are bars and restaurants up 41.7% in the year-on-year measure; travel and tourism by 39.0%, and retailers 17.8%. Significant financial distress rose 10.8% to 666,876 businesses, notably up 15.2% on the first quarter of 2025.
Only six of 22 industries saw a year-on-year reduction in significant distress, including printing and packaging (which surprises me as these are generally cyclical), manufacturing, industrial transportation and logistics.
At 121p, Begbies shares did not respond, though did rally from 110p to 125p in July after annual results to 30 April cited 10% organic revenue growth and 2% acquired growth. Free cash flow jumped 56%, enabling an 8% rise in the proposed dividend and continued buybacks. Consensus expects a remarkable 64% earnings per share growth in this current financial year, based on near £18 million net profit, with the forward price/earnings (PE) just above 11x given the market is cautious as to how long an insolvency bonanza could continue.
- The secret behind 20 years of 15% returns
- What’s happened to defensive stocks?
- Sign up to our free newsletter for investment ideas, latest news and award-winning analysis
A 3.7% yield rising to 3.9% in the April 2026 year is also no big pull for income investors, based on 2.4x expected earnings cover showing the board is similarly cautious.
I rated Begbies “buy” at 100p in May and it is a tough call whether I should adjust to a “hold”. It hinges on whether this latest update is a portent of worse to come. Given the UK chancellor’s predicament – likely spending cuts and further tax rises ahead – I stay with “buy”. The UK economy risks a “debt doom loop” where such actions conspire to depress overall economic activity, while struggling to cope with public debt at 101% of gross domestic product, and long-term borrowing costs at two-decade highs.
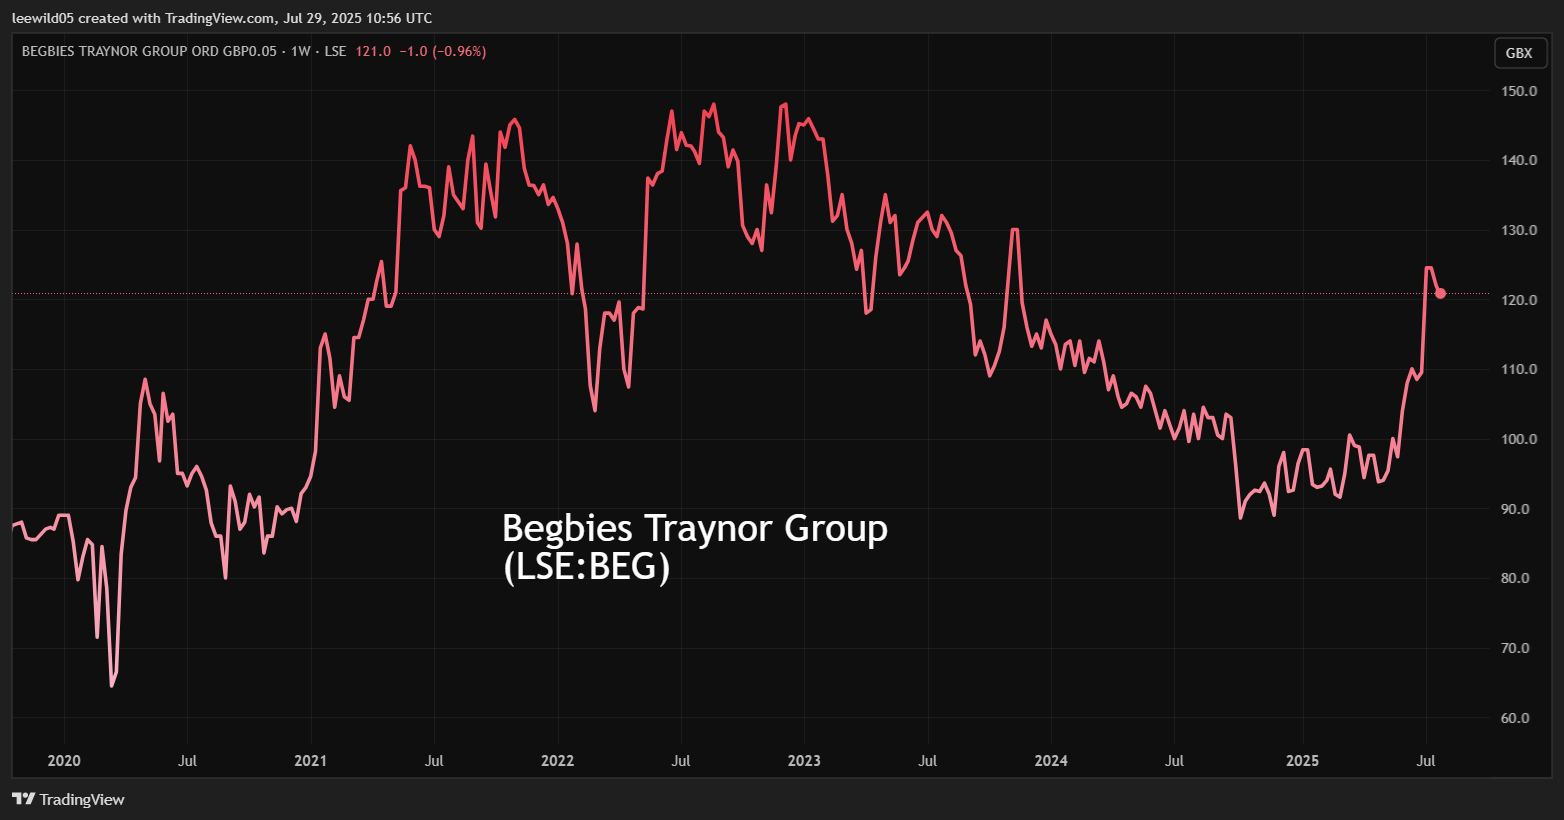
Source: TradingView. Past performance is not a guide to future performance.
A cinema group withstands the gloom fest
Everyman Media Group (LSE:EMAN) which operates 48 cinemas in the UK and generates significant revenue from food and drink, cites its first-half admissions up 15% to 2.2 million and revenue up 21% to £56.5 million.
Cinema attendance involves highly discretionary spending given there is competition also from Netflix, and it has suffered in past recessions. Mind that Everyman has in the last year increased its estate from 41 to 48 venues, implying roughly flat like-for-like performance, but I am quite surprised to see even this.
Mind also, management does not elucidate any trend between quarters, but given it says “we look forward to building on this momentum in the second half of this year,” they will be on the hook if they temper their narrative at the 24 September interim results. The CEO added £30,000 worth of shares at 40p in May, a near 25% increase in his stake, and an encouraging sign.
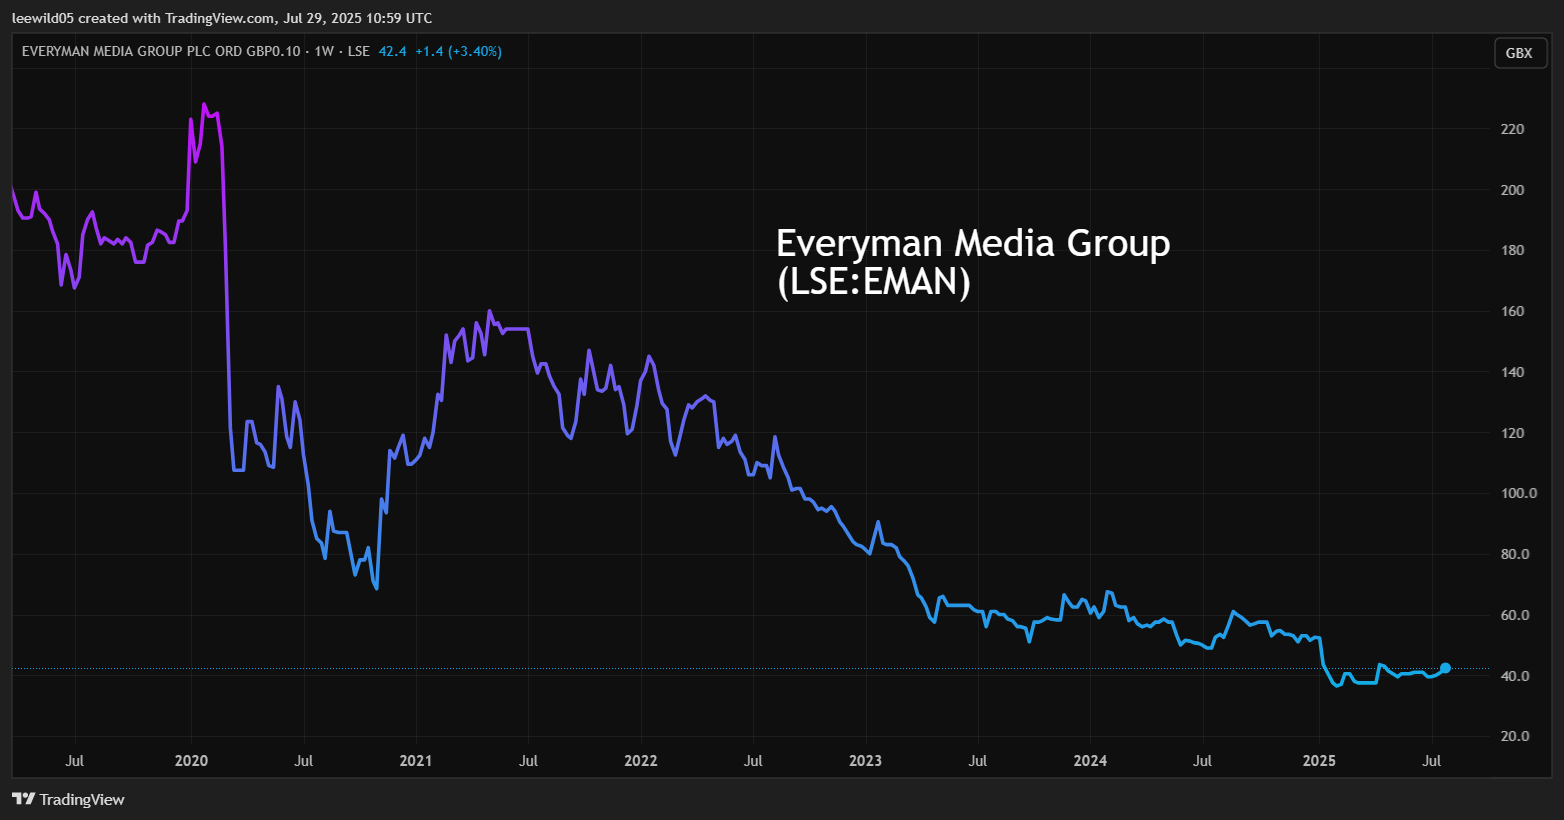
Source: TradingView. Past performance is not a guide to future performance.
I believe Everyman’s resilience reflects the ongoing trend of UK wage increases - the consumer economy dividing between those fortunate enough to benefit, and lower-paid people feeling a squeeze from higher food prices and other inflation. In its first half, Everyman was able to pass on cost increases: a 6.0% like-for-like rise in the average ticket price to £12.46 with average food and drink spend per head similarly up 5.9% to £11.09.
While this is relatively respectable, consistency with retaining a “buy” stance on Begbies makes me wary to rate Everyman better than a “hold”. At 43p, this £39 million AIM-listed group has been loss-making since Covid, and its debt/leases interest burden extend its operating losses. While it remains a dicey call as to how the UK economy will fare, it would not seem responsible of me to advocate Everyman as a home for fresh money.
- 10 hottest ISA shares, funds and trusts: week ended 25 July 2025
- Insider: a £100k bet on FTSE 250 stock at 18-month low
At end-2024 it had increased cash to £9.9 million from £6.6 million, so unless there is reckless expansion the group should be able to cope with recession. Net bank debt was trimmed from £18.4 million to £18.1 million, but there was also £106.2 million of leases (chiefly long term), while finance expenses rose 26% to £6.9 million, hence a £3.4 million operating loss becoming a £10.2 million pre-tax loss.
It is just possible that Everyman shares climb the proverbial “wall of worry” like they started from 36.5p in February. The price rose 5% to 43p after this latest update and shares trade around end-2024 net asset value of £36.4 million where 25% constitute intangibles. There is no dividend policy, however.
A potential silver lining for shareholders is the shares responding to interest rate cuts if we do see a recession, albeit highly speculative. Everyman does as yet also serve as a useful reminder that despite darkening macro clouds over the UK, there are some sectors showing resilience.
Everyman Media Group - financial summary
year end 2 Jan
| 2015 | 2016 | 2017 | 2018 | 2019 | 2020 | 2021 | 2022 | 2023 | 2024 | 2025 | |
| Turnover (£ million) | 14.1 | 20.3 | 29.6 | 40.6 | 51.9 | 65.0 | 24.2 | 49.0 | 78.8 | 90.9 | 107 |
| Operating margin (%) | 2.1 | -3.7 | 1.9 | 4 | 5.5 | 7.4 | -77.8 | -4.4 | 0.5 | -0.1 | -3.1 |
| Operating profit (£m) | 0.3 | -0.8 | -0.6 | 1.6 | 2.9 | 4.7 | -18.8 | -2.2 | 0.4 | -0.1 | -3.4 |
| Net profit (£m) | 0.2 | -0.6 | 0.1 | 1.3 | 2.0 | 1.7 | -20.1 | -5.4 | -3.5 | -2.7 | -8.5 |
| EPS - reported (p) | 0.5 | -1.1 | 0.1 | 2.0 | 2.8 | 2.4 | -23.6 | -6.0 | -3.8 | -3.0 | -9.4 |
| EPS - normalised (p) | 0.5 | -0.7 | 0.1 | 2.1 | 2.8 | 2.5 | -22.8 | -10.5 | -3.1 | -2.0 | -7.1 |
| Operating cashflow/share (p) | 6.0 | 5.8 | 9.1 | 21.3 | 10.4 | 21.8 | -6.3 | 13.4 | 12.9 | 19.6 | 23.7 |
| Capital expenditure/share (p) | 10.0 | 22.3 | 31.8 | 24.8 | 31.5 | 32.9 | 10.0 | 8.6 | 21.9 | 21.3 | 17.6 |
| Free cashflow/share (p) | -4.0 | -16.5 | -22.7 | -3.5 | -21.1 | -11.2 | -16.3 | 4.8 | -8.9 | -1.7 | 6.1 |
| Cash (£m) | 6.4 | 9.2 | 1.6 | 18.4 | 3.5 | 4.3 | 0.3 | 4.2 | 3.7 | 6.7 | 9.9 |
| Net debt (£m) | -6.1 | -9.2 | 1.5 | -11.3 | 3.5 | 86.2 | 87.8 | 90.2 | 105 | 123 | 124 |
| Net assets (£m) | 13.2 | 31.9 | 32.3 | 51.3 | 54.1 | 55.2 | 52.4 | 48.2 | 46.3 | 44.4 | 36.5 |
| Net assets per share (p) | 36.2 | 53.3 | 53.9 | 73.3 | 76.7 | 60.6 | 58.2 | 52.9 | 50.7 | 48.7 | 40.0 |
Source: historic company REFS & published accounts.
Edmond Jackson is a freelance contributor and not a direct employee of interactive investor.
These articles are provided for information purposes only. Occasionally, an opinion about whether to buy or sell a specific investment may be provided by third parties. The content is not intended to be a personal recommendation to buy or sell any financial instrument or product, or to adopt any investment strategy as it is not provided based on an assessment of your investing knowledge and experience, your financial situation or your investment objectives. The value of your investments, and the income derived from them, may go down as well as up. You may not get back all the money that you invest. The investments referred to in this article may not be suitable for all investors, and if in doubt, an investor should seek advice from a qualified investment adviser.
Full performance can be found on the company or index summary page on the interactive investor website. Simply click on the company's or index name highlighted in the article.
Disclosure
We use a combination of fundamental and technical analysis in forming our view as to the valuation and prospects of an investment. Where relevant we have set out those particular matters we think are important in the above article, but further detail can be found here.
Please note that our article on this investment should not be considered to be a regular publication.
Details of all recommendations issued by ii during the previous 12-month period can be found here.
ii adheres to a strict code of conduct. Contributors may hold shares or have other interests in companies included in these portfolios, which could create a conflict of interests. Contributors intending to write about any financial instruments in which they have an interest are required to disclose such interest to ii and in the article itself. ii will at all times consider whether such interest impairs the objectivity of the recommendation.
In addition, individuals involved in the production of investment articles are subject to a personal account dealing restriction, which prevents them from placing a transaction in the specified instrument(s) for a period before and for five working days after such publication. This is to avoid personal interests conflicting with the interests of the recipients of those investment articles.
Editor's Picks