Trading the dip: inside the mind of an emotional investor
Read the article our companies analyst and long-term investor thought he would never write.
28th February 2020 15:44
Read the article our companies analyst and long-term investor thought he would never write.

Today we interrupt the usual flow of company analysis to bring you an article I never thought I would write: Trading the dip.
Word has got to me via Twitter, news headlines, and friends and relatives that share prices are falling. This is not something I generally pay attention to, and the fact that I am paying attention to it now is a coincidence. On Wednesday, my editor suggested I should talk a bit about the emotional aspect of trading at an event he is organising, and aware that right now traders may be experiencing emotions, I thought it would be a good idea to put myself in their position. Now I feel compelled to write about the experience!
How the other half lives
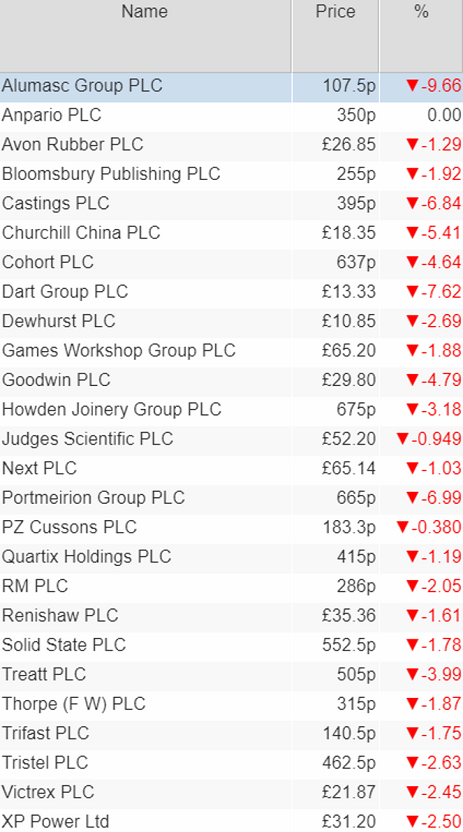
This is a screenshot of the Share Sleuth portfolio, a model portfolio I run for interactive investor's sister website Money Observer, showing a view I have never previously looked at: How the shares in my portfolio have performed since the previous day’s close. My reputation depends in part on the performance of the Share Sleuth portfolio and a large part of my own pension is invested in the same companies, so this is real to me:

Source: SharePad
It’s terrifying! I took the screenshot on Wednesday, but I am writing this article on Thursday, and the view is little better. If I had looked on Tuesday, it would probably have been scary too, and for all I know Friday will be as well. Confronted with an ocean of red, it is very difficult not to fret, yet I imagine something like this view is the default for many investors, however they track their shares.
An algorithm powered by purest green
I didn’t think I would write an article about trading dips because I don’t consider myself to be a trader. In fact, I find trading incredibly stressful. Day to day, I don’t know whether my shares are up or down because I outsource my trading decisions to an algorithm that slows everything down and tells me when to act. It’s designed to minimise the amount of time I spend thinking about trading, and maximise the amount of time I have to learn about businesses and live a little, activities I find more appealing.
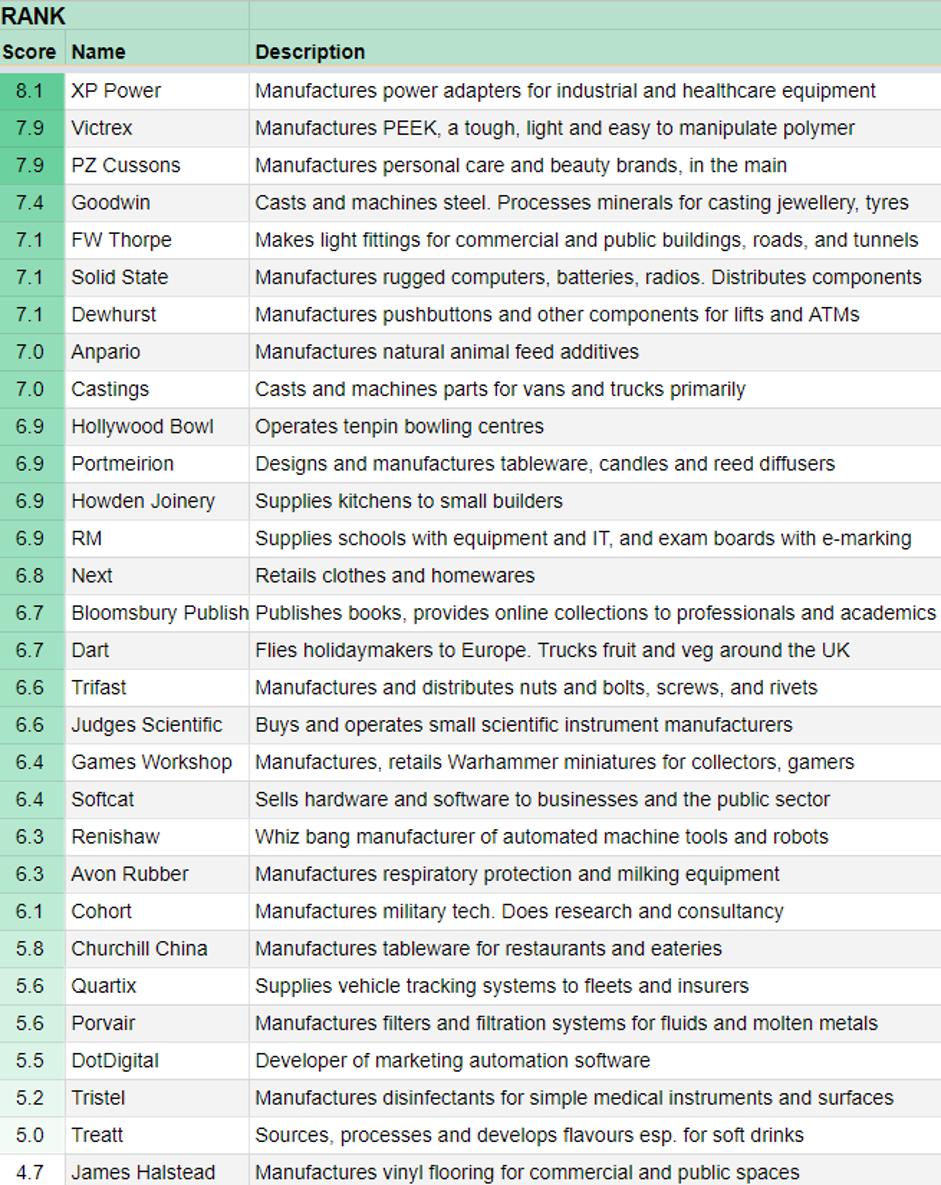
The algorithm starts with the scores in my Decision Engine, the ranked list of shares we publish every five weeks. The list, created in a spreadsheet, is my default view for the companies I follow most closely, and this is how it looked on Wednesday:

Source: The author
In summary, I use five factors to help me decide whether a company is a good long-term investment, four relate to the business (profitability, risks, strategy, and fairness), and the fifth relates to its valuation. I re-evaluate businesses at least once a year and publish the outcomes here on Interactive Investor. Valuations are updated daily using the previous day’s closing prices. If you think the output looks slick, remember that whether it works or not depends on the judgements I feed into the Decision Engine.
As you can see, the spreadsheet is made of purest green, specifically because it has a calming effect. To score a share highly I must hold the business in high regard and the valuation must be relatively modest. You cannot see this by looking at a snapshot of the Decision Engine on a single day, but if share prices fall, the Decision Engine gets greener, and consequently more reassuring. It’s the opposite of the red arrows that most people see and it reinforces the old investor aphorism, often attributed to Warren Buffett, that it is best to be fearful when others are greedy and greedy when others are fearful.
Ideal holding size
Generally speaking, I want to have more money invested in highly ranked shares than lowly ranked ones, and to decide how much I determine what the ideal holding size is for each share. In turn, the ideal holding size is determined by the share’s score and how many shares I want to hold in a portfolio.
For the Share Sleuth portfolio, which holds about 25 shares, the ideal holding size as a percentage of the value of the whole portfolio is 75% of a share’s score. For example XP Power (LSE:XPP) scores 8.1 and its ideal holding size is a shade over 6% of the portfolio’s total value. A smaller portfolio would perhaps have an holding size equivalent to the score.
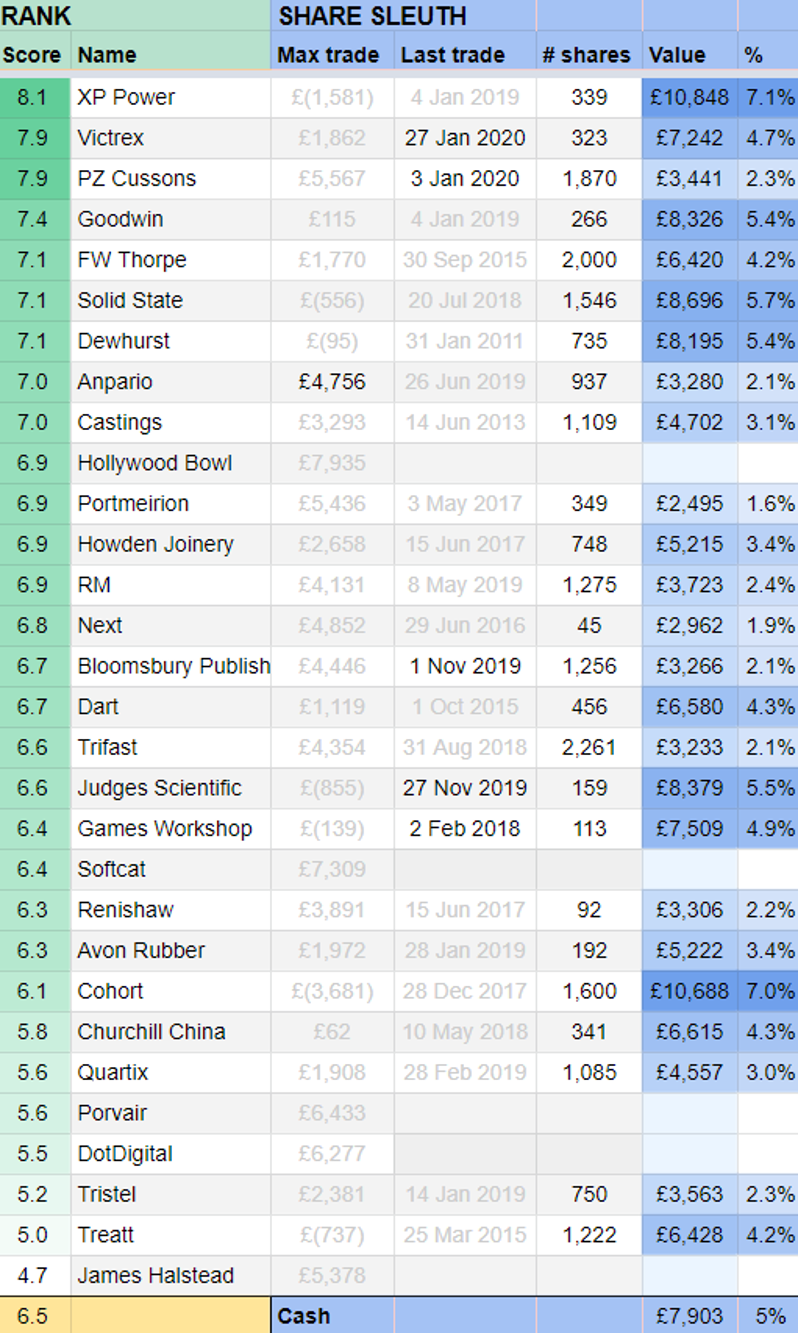
XP Power is the highest ranked share, and on Wednesday Share Sleuth’s holding was worth £10,848, 7.1% of the portfolio’s total value (see the first row of the table below). In theory, Share Sleuth owns too many shares, but in practice it would be maddening, and expensive, were we to trade every time we owned slightly more of a share than we should, so the algorithm depends on two more variables to prevent over-trading.

Source: The author
Minimum trade size
One is the minimum trade size, which is 2.5% of the portfolio’s total value. I forgot to note what that was on Wednesday, but today (Thursday) it is £3,725. The difference between the ideal holding size of XP Power and the actual holding size is calculated in the Max Trade column. It is -£1,581 the minus sign indicates I would need to reduce the holding to get it to the ideal size, but the absolute value is less than the minimum trade size, so it is greyed out. The Decision Engine is telling me not to sell because the trade is not significant.
The other variable to prevent overtrading is the date of my last trade. I will not trade a share if I have traded it in the last six months. I can’t trade third ranked PZ Cussons (LSE:PZC), even though the maximum trade available to me (+£5,567) is well above the minimum trade size, because my last trade was on 3 January. That’s not to say I think trading every six months is a good idea. My last trade for Dewhurst (LSE:DWHT) was in 2011, and that was a top up to an existing holding.
Feeling greedy and fearful
The only trade available to me on Wednesday, the only one not greyed out, was Anpario (LSE:ANP), and the Decision Engine advocated topping up Share Sleuth’s holding by a maximum of £4,756.
I am unlikely to do that immediately, because Anpario will soon publish its annual results and I will re-evaluate the company then. Look down the list, though, and you will see an army of shares scoring just less than 7 which I can also trade in meaningful size. These trades are greyed out because I prefer to buy shares that score more than 7. If the sell-off continues though, some of the shares will surely move higher. Even if it doesn’t, I sometimes break this arbitrary threshold if I believe a business is of the highest quality.
Of all these shares the most enticing is Hollywood Bowl (LSE:BOWL), which on Wednesday scored 6.9. I re-evaluated Hollywood Bowl only recently (you can read my verdict here) and I do not already own the share, either in the Share Sleuth portfolio or my pension. I plan to consider this trade on Friday morning* and since this article won’t be published until the late afternoon, I might already have executed it by the time you read this. That’s about as close as you can get to being inside my mind (and inside the Decision Engine’s algorithm) as I make a trade.
I am feeling emotional, but my emotions are broadly positive. The work I have done to score these shares means I am confident in their long-term potential, and while I don’t feel greedy exactly, falling prices are improving my appetite.
But, like seeing your parents naked, the image of my portfolio lit in red is a difficult one to un-see. If investing in a company that operates tenpin bowling alleys seems slightly crazy to you while fears of a global pandemic that would probably close public venues takes hold, it does to me too, now!
~
* If Richard adds Hollywood Bowl to the Share Sleuth portfolio, he is very likely to buy the shares for himself, but he is prohibited to buy (or sell) shares for a week before and after publication by interactive investor’s trading policy.
Richard owns shares in all of the shares currently in the Share Sleuth portfolio, which you can see in the third table.
Contact Richard Beddard by email: richard@beddard.net or on Twitter: @RichardBeddard.
Richard Beddard is a freelance contributor and not a direct employee of interactive investor.
Disclosure
We use a combination of fundamental and technical analysis in forming our view as to the valuation and prospects of an investment. Where relevant we have set out those particular matters we think are important in the above article, but further detail can be found here.
Please note that our article on this investment should not be considered to be a regular publication.
Details of all recommendations issued by ii during the previous 12-month period can be found here.
ii adheres to a strict code of conduct. Contributors may hold shares or have other interests in companies included in these portfolios, which could create a conflict of interests. Contributors intending to write about any financial instruments in which they have an interest are required to disclose such interest to ii and in the article itself. ii will at all times consider whether such interest impairs the objectivity of the recommendation.
In addition, individuals involved in the production of investment articles are subject to a personal account dealing restriction, which prevents them from placing a transaction in the specified instrument(s) for a period before and for five working days after such publication. This is to avoid personal interests conflicting with the interests of the recipients of those investment articles.
These articles are provided for information purposes only. Occasionally, an opinion about whether to buy or sell a specific investment may be provided by third parties. The content is not intended to be a personal recommendation to buy or sell any financial instrument or product, or to adopt any investment strategy as it is not provided based on an assessment of your investing knowledge and experience, your financial situation or your investment objectives. The value of your investments, and the income derived from them, may go down as well as up. You may not get back all the money that you invest. The investments referred to in this article may not be suitable for all investors, and if in doubt, an investor should seek advice from a qualified investment adviser.
Full performance can be found on the company or index summary page on the interactive investor website. Simply click on the company's or index name highlighted in the article.
Editor's Picks