What the Wall Street cheat sheet says about stocks now
If you’re trying to figure out whether stocks are worth buying right now, Jonathan Hobbs says this handy reference could be a guide. Here's how to use it.
6th September 2024 09:19
Jonathan Hobbs from Finimize

- The Wall Street Cheat Sheet’s Psychology of a Market Cycle lists 13 emotions that investors experience in a typical stock market cycle.
- The cheat sheet can provide clues on where the stock market might be in its cycle – and can help you tailor your strategy accordingly.
- Risky “high-beta” tech stocks are typically more sensitive to market sentiment, making them a useful gauge for spotting changes in investor emotions.
Warren Buffett said it best: “Be fearful when others are greedy, and be greedy when others are fearful”. That simple mantra about going against the crowd can help you sell closer to the top and buy closer to the bottom. But to do that, you’ll need to keep an eye on sentiment – i.e., how most investors feel – and try to feel the opposite. So I’ve pulled out the famous Wall Street Cheat Sheet’s Psychology of a Market Cycle Guide to get you started.
How does the cheat sheet work?
The cheat sheet lists 13 emotions that investors go through during the boom and bust of a stock market cycle. I’ve drawn my own version below using the Nasdaq’s dot-com bubble – but you can apply it to any investment with major price swings. (Looking at you, crypto). Keep in mind, this particular cycle example is extreme – but it does vividly explain the concept.
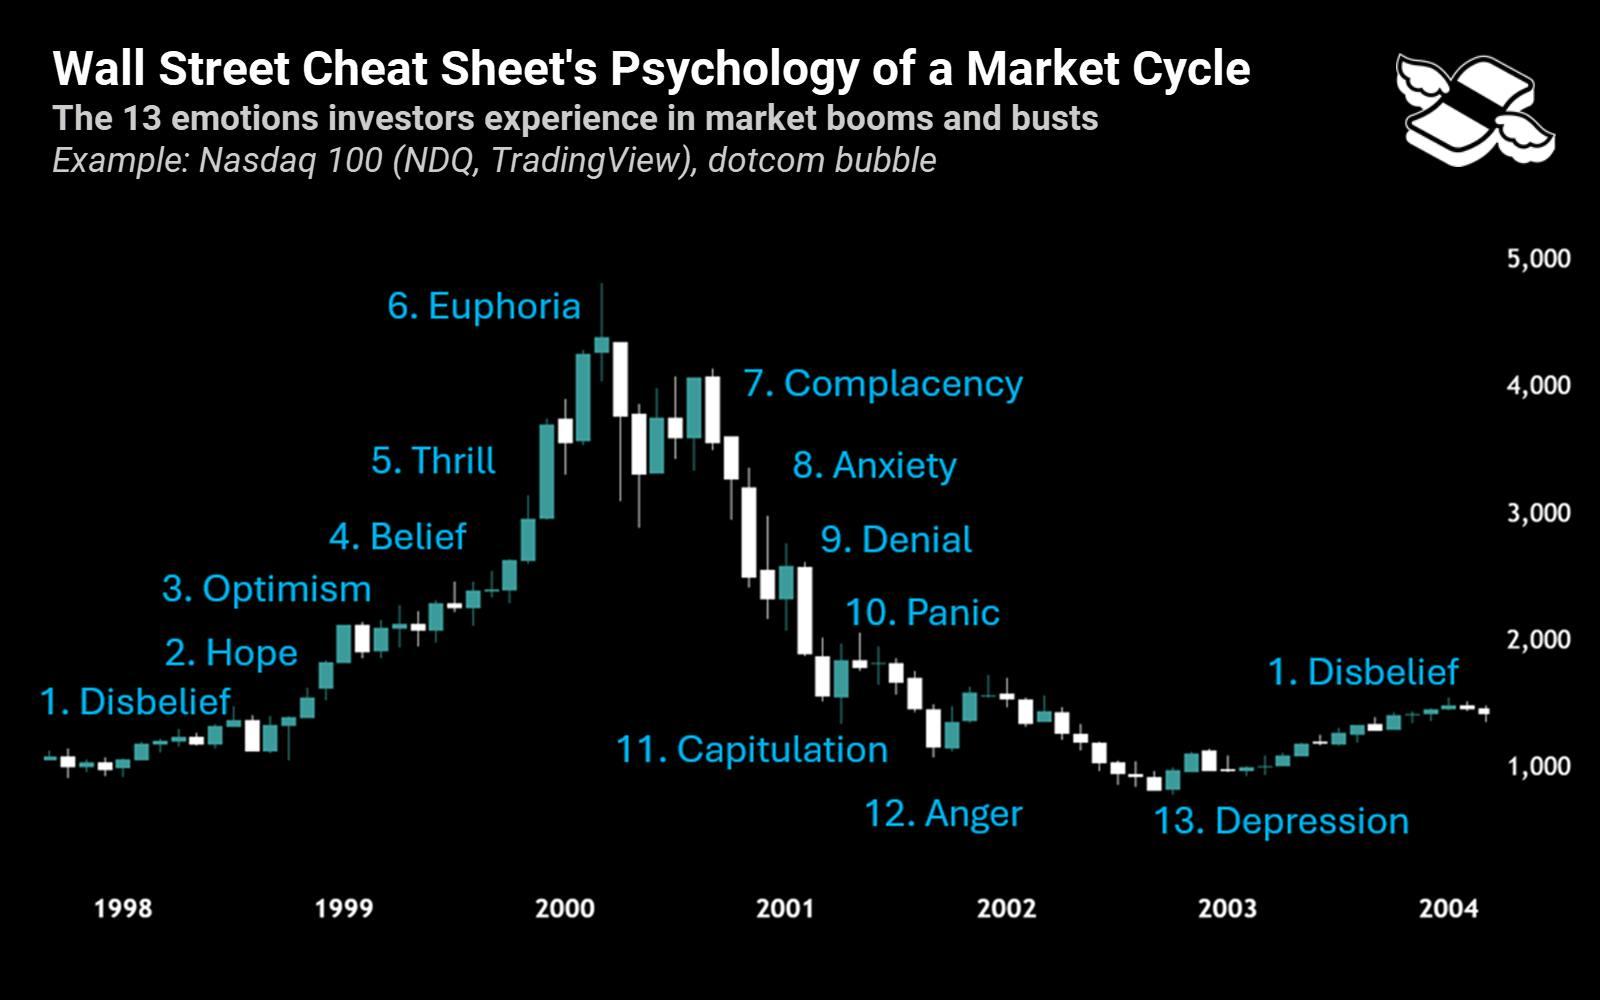
During a typical boom and bust market cycle, investors experience 13 emotions, according to the Wall Street Cheat Sheet’s Psychology of a Market Cycle. Sources: Wall Street Cheat Sheet, TradingView.
According to the cheat sheet, you can simplify a market cycle into four key phases: expansion (when prices rise), peak (when prices top out), contraction (when prices fall), and trough (when prices bottom out). The phases overlap somewhat, but each one has telltale signs of investor emotional behaviour.
The expansion phase kicks off with investors feeling disbelief – as prices start rising in what’s unsurprisingly called a “disbelief rally”. At this point, investors are conditioned to see prices going down, so they think the run-up will fail like all the others. But instead, the upward move keeps chugging along, so they start to hope for a possible recovery. Then comes investor optimism as they start to think the rally could be real, followed by belief, when they fully invest in the market.
Things then shift into the peak phase, when the “smart money” starts selling and taking profits. But for everyone else, there’s a thrill in the air – with many investors buying stocks on margin (that’s borrowed money). The thrill then switches to euphoria, when prices go vertical and players feel they can’t lose. And that’s typically when a surge of sell orders hits, driving stock prices down and catching the latecomers off guard. Many people jump back in at this point – still programmed by the expansion phase to "buy the dip" – convinced that the market will rebound and go higher still. And they feel complacent when that doesn’t happen, thinking things just need to cool off before the next big rally.
The contraction phase starts with investor anxiety, as the dip keeps… dipping. At this point, overleveraged investors face margin calls, pushing them to exit their positions for a loss. Next, denial creeps in as prices take another tumble, which gradually turns to panic. And that gives way to capitulation, as folks throw in the towel, close to the low.
The trough phase begins with anger, as investors blame all sorts of things for their losses. And it ends with depression – where they lose all hope of a recovery. It’s kind of grim.
So, what phase is the market in now?
If Sherlock Holmes were an investor, he’d probably use the process of elimination to try and answer this (seriously tricky) question. So, yeah, that’s what I’ll do – and I’ll stick with the Nasdaq here to focus more on tech stocks. After all, they tend to be on the higher “beta” end of the risk spectrum, meaning they’re generally more reactive to investor sentiment (whether up or down).
Now, I think we can all agree that the Nasdaq’s last trough phase was from late 2022 to early 2023 (red rectangle). Recall that even though US inflation was coming down then, the Federal Reserve was still raising interest rates, and investor sentiment was generally quite bleak – with many predicting a major recession. But according to the cheat sheet, that would’ve been the best time to buy.
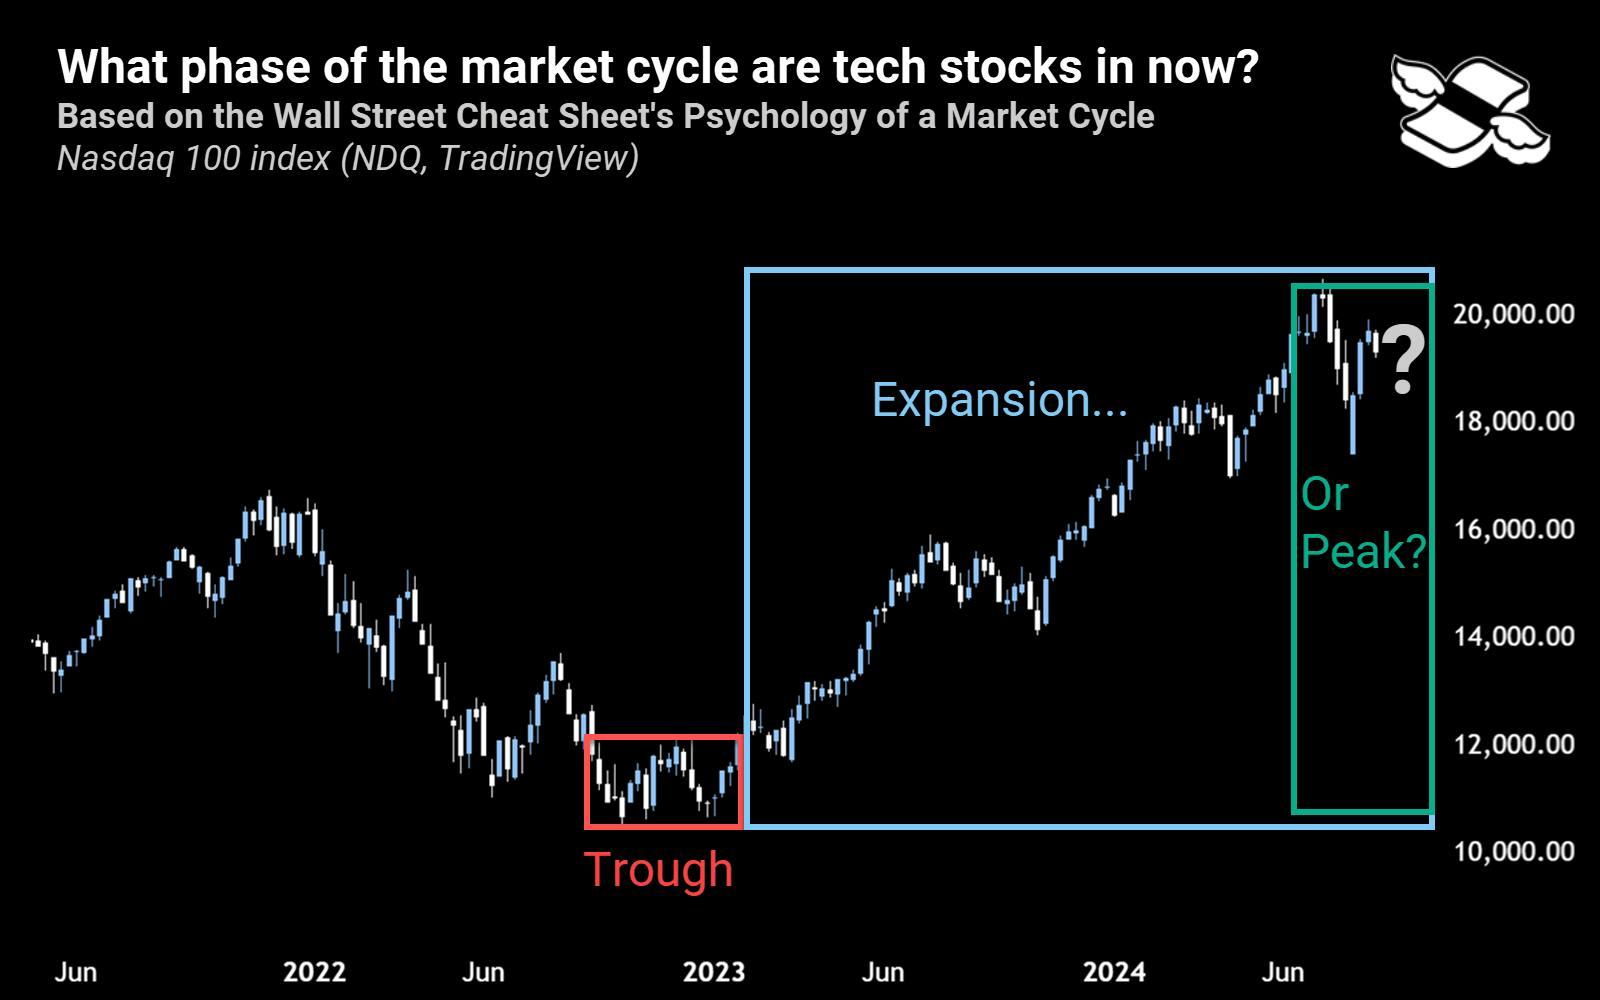
Tech stocks appear to be in either the expansion phase (blue) or the peak phase (green) right now. Source: TradingView.
We’ve also clearly seen a big expansion phase (blue), with the Nasdaq almost doubling in less than two years. And looking at the chart above, we could still be in the expansion phase. Then again, if we’re going strictly by the cheat sheet, it looks more like we’re at the complacency end of the peak (green) – for now, at least.
So, what should you do now, according to the cheat sheet?
The first step is to ask yourself how you feel about the market – because that might give you an inkling about the current market sentiment. Checking in with friends and colleagues, scrolling social media, and tuning into market news can give you a better gauge of the prevailing investor emotions.
You could also consider taking a page out of Buffett’s book. At the end of June, his investment firm, Berkshire Hathaway Inc Class B (NYSE:BRK.B), had 25% of its assets sitting in cash ($278 billion). And that’s a bigger proportion than it’s had in almost 20 years.
So these days, Buffett’s clearly less greedy than most.
Jonathan Hobbs is an analyst at finimize.
ii and finimize are both part of abrdn.
finimize is a newsletter, app and community providing investing insights for individual investors.
abrdn is a global investment company that helps customers plan, save and invest for their future.
These articles are provided for information purposes only. Occasionally, an opinion about whether to buy or sell a specific investment may be provided by third parties. The content is not intended to be a personal recommendation to buy or sell any financial instrument or product, or to adopt any investment strategy as it is not provided based on an assessment of your investing knowledge and experience, your financial situation or your investment objectives. The value of your investments, and the income derived from them, may go down as well as up. You may not get back all the money that you invest. The investments referred to in this article may not be suitable for all investors, and if in doubt, an investor should seek advice from a qualified investment adviser.
Full performance can be found on the company or index summary page on the interactive investor website. Simply click on the company's or index name highlighted in the article.
Editor's Picks