Analyst gives Avacta shares a health check
As an impressive bounce early in the summer begins to unwind, independent analyst Alistair Strang searches this share's chart for clues as to future direction.
24th September 2024 07:20

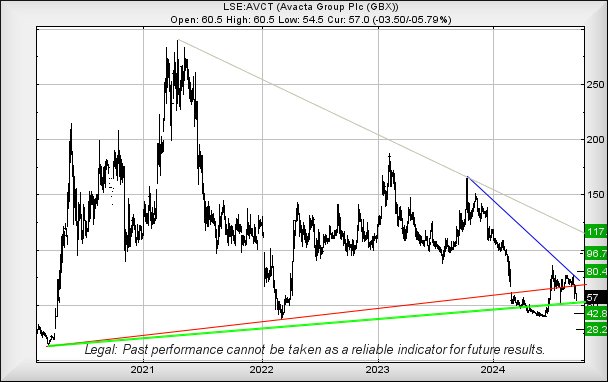
We previously reviewed Avacta Group (LSE:AVCT) back in June, allocating a target of 68.2p and the potential of the share price taking the important step of regaining a four-year-old uptrend. This is usually a big deal, something important, as it generally signifies a share price which intends to head higher, potentially a lot higher. And this is where it all went wrong!
- Invest with ii: Open a Stocks & Shares ISA | ISA Investment Ideas | Transfer a Stocks & Shares ISA
The price certainly regained the uptrend, even exceeding our target and reaching 86p briefly, then it dropped like a stone, eventually deciding 52p was a bottom. Then it bounced, again exceeding the Red line since 2020. We’re inclined to view the Red uptrend as a “fake”, something the market is ignoring.
Using a Green crayon, we’ve illustrated yet another uptrend since 2020, one which may prove of interest in the future. We habitually examine how share prices move in relation to established trend lines as these dance steps invariably give away the game. In this instance, we’re simply not sure as to the markets intention.
Due to Avacta's share price exceeding our secondary target in July, August, and September, we’re inclined toward some hope for the future. It’s also trading above our emergency Green line on the chart below, perhaps an indication the Red trend line was a fake. If we’re correct in this piece of paranoia, above just 68p should now prove useful, allegedly capable of triggering share price recovery to an initial 80p with our secondary, if bettered, at 96p, along with an expected pause for thought.
Of course, our alternate scenario warns of danger below 61p, bringing reversal to an initial 42p with our secondary, if broken, a less certain 28p.
Sorry we cannot be more precise for those who emailed. If the Green line is indeed important, a bounce should be imminent but overall, we’re a little confused.
Source: Trends and Targets. Past performance is not a guide to future performance.
Alistair Strang has led high-profile and "top secret" software projects since the late 1970s and won the original John Logie Baird Award for inventors and innovators. After the financial crash, he wanted to know "how it worked" with a view to mimicking existing trading formulas and predicting what was coming next. His results speak for themselves as he continually refines the methodology.
Alistair Strang is a freelance contributor and not a direct employee of Interactive Investor. All correspondence is with Alistair Strang, who for these purposes is deemed a third-party supplier. Buying, selling and investing in shares is not without risk. Market and company movement will affect your performance and you may get back less than you invest. Neither Alistair Strang or Interactive Investor will be responsible for any losses that may be incurred as a result of following a trading idea.
These articles are provided for information purposes only. Occasionally, an opinion about whether to buy or sell a specific investment may be provided by third parties. The content is not intended to be a personal recommendation to buy or sell any financial instrument or product, or to adopt any investment strategy as it is not provided based on an assessment of your investing knowledge and experience, your financial situation or your investment objectives. The value of your investments, and the income derived from them, may go down as well as up. You may not get back all the money that you invest. The investments referred to in this article may not be suitable for all investors, and if in doubt, an investor should seek advice from a qualified investment adviser.
Full performance can be found on the company or index summary page on the interactive investor website. Simply click on the company's or index name highlighted in the article.
Editor's Picks