Capital dividends: what income investors need to know
Kepler’s Alan Ray tackles the maths of such payouts, so you don’t have to, finding both surprises and simplicity in the numbers.
25th July 2025 14:00

This content is provided by Kepler Trust Intelligence, an investment trust focused website for private and professional investors. Kepler Trust Intelligence is a third-party supplier and not part of interactive investor. It is provided for information only and does not constitute a personal recommendation.
Material produced by Kepler Trust Intelligence should be considered a marketing communication, and is not independent research.
One thing I’ve noticed in my parallel life as a mature university student is that sometimes experts struggle to explain concepts because they are so expert in a topic that it’s become second nature. To them, the idea that something needs explaining is akin to having to explain why it’s important to keep breathing. Luckily for me, and annoyingly for my professors, a few years in the City have given me high levels of confidence to ask stupid questions, so we normally get there in the end.
I found myself in a situation recently where the conversation took a turn against the concept of paying capital dividends, with a range of opinions but a consensus that they were a BAD THING. Showing an unusual degree of restraint, I just nodded and moved things along to the next subject, but I did think that’s interesting, I didn’t know people still felt that way. This was probably the right thing to do because in my mind capital dividends are a bit like breathing. Why wouldn’t you pay a capital dividend? I needed a few hours to get my argument straight, so here goes.
Before we get into things, let’s clear one thing up. It’s a totally valid and successful strategy to invest in companies that pay ‘real’ dividends. The most obvious reason to do so is to collect and spend them, but it may also be because a company’s ability to pay, sustain and grow its dividend says something about its underlying business.
There will be many investors happy with the income and growing dividends they receive from UK equity income trusts, exemplified by City of London Ord (LSE:CTY) and its extraordinary run of dividend increases (59 years and counting…). And I daresay that many who chose to invest in UK equity income trusts reinvest their dividends. They just like the kinds of companies those trusts invest in.
Or let’s think about the £2 billion Fidelity European Trust Ord (LSE:FEV), not especially high yielding, but the managers place a great deal of emphasis on dividend growth in their stock selection. FEV has a tremendous record of dividend growth and its low-ish yield is a result of its very strong capital growth, which is the ultimate nice problem to have as an income investor.
Capital dividends allow investors to access different strategies which favour other types of companies, and so one might expect performance to have different characteristics. It’s sometimes said that companies that pay steady and growing dividends are mature businesses that have past their best growth years and are happy just continuing on the same path.
Investors who bought Microsoft Corp (NASDAQ:MSFT) when it started paying a dividend might have cause to disagree with that, but nevertheless, on average that characteristic is rooted in truth, and may well be exactly what an investor likes. Strategies investing in companies with no yield can provide access to businesses at a different stage in their lifecycle, where retaining earnings for investment might result in higher returns. Or, it might just be that in a particular market the culture is different and dividends are seen as less important, and share buybacks are favoured.
Warning: some mathematics
I’ll preface this by saying that I’m sure that there are those who don’t like capital dividends and who perfectly well understand the following mathematics. For all the financial modelling and big-data AI analysis the industry uses these days, instinct matters in investing, and if that’s a reader’s instinct, I say go with it. But on the chance that a reader hasn’t yet considered the numbers, let’s first walk through a simple example and then some different scenarios.
Let’s take an investment trust with a net asset value of 100p per share, a share price of 90p and thus trading at a discount of 10%. The trust pays a dividend of 4% of net asset value and, to keep things simple, it does it all in one go. In the real world this would most likely be quarterly, but the outcome will be similar.
Now, let’s take an investor who has invested £1,000 at that 90p share price and thus has 1,111 shares and some change left over.
- The dividend the trust will pay is [4% x NAV] or [4% * 100p] = 4p per share.
- The investor receives a dividend of [£0.04 * 1,111] = £44.44.
Now comes the clever bit. Clearly, one option is to spend the dividend. Perhaps grumbling about how you never wanted a capital dividend in the first place, but still, money is money, right? But what happens if you reinvest it?
- Taking the £44.44, the investor buys some more shares at 90p per share. Ignoring stamp duty only for this example, that buys 49 more shares leaving a tiny bit of change.
So, the investor now owns 1,160 shares. The next day the investor is shocked to see that the NAV of the trust has fallen from 100p to 96p. Because the dividend is entirely paid from capital, the NAV is now [100p –4p) = 96p. And, maintaining the discount at 10%, the share price is now 86.4p. This can’t be good, surely?
- Before the dividend was paid, the shareholder owned 1,111 shares at 90p = £999.90
- After the dividend reinvestment the shareholder owns 1,160 shares at 86.4p = £1,002.24
Let’s go one step further and think about the underlying NAV the investor owns.
- Before the dividend was paid, 1,111 shares had an NAV of 100p, so the investor owns £1,111.00 of NAV.
- After the dividend was reinvested, 1,160 have an NAV of 96p, so the investor owns £1,113.60.
This last bit is important because NAV is, perhaps obviously, the engine of growth. The investor who reinvests their dividend is getting a slightly bigger engine without putting any more money to work. I won’t torture readers with another maths lesson, but conceptually, the value accretion of an investment trust buying its own shares back is very similar. Think of it like this, the investor has been handed a little piece of the NAV and used it to buy shares at the lower share price.
What does this mean for long-term returns?
Let’s take that maths and put it into an Excel spreadsheet and expand it across 10 years. Don’t worry though, we’ll just be looking at the chart that results and not diving too far into hypothetical numbers. Scenario A takes that same investor and then sees what happens if they continue to reinvest dividends over 10 years. This time, to be pedantic, we have charged them stamp duty each time they reinvest. Maybe in 10 years the nonsense of stamp duty on share purchases in the UK will be no more, but that’s another story. Each year, the investment trust’s NAV grows by 10%.
This is pitted against an identical investment trust, except that it does not pay any dividends. The investor simply buys, holds, and gets the same NAV growth rate and the same discount, 10%, persists throughout the 10 years.
The chart below shows the value of the two investments. This is the actual value at the share price. That slightly bigger engine we discussed above has, over 10 years, opened a slight gap. It is slight but it’s a gap.
Scenario A
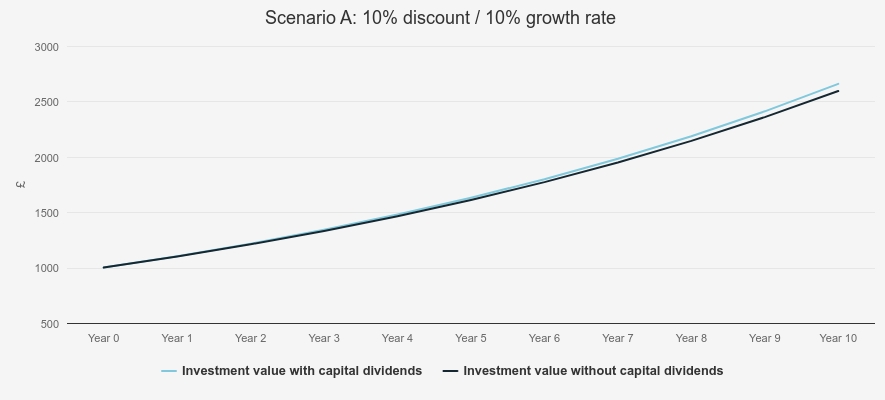
Source: Kepler
Scenario B is identical except that the annual growth rate is negative 10%. Again, the reinvestment strategy works in the investor’s favour, with a slightly higher value, although obviously it can’t protect from a 10% annualised fall in NAV.
Scenario B
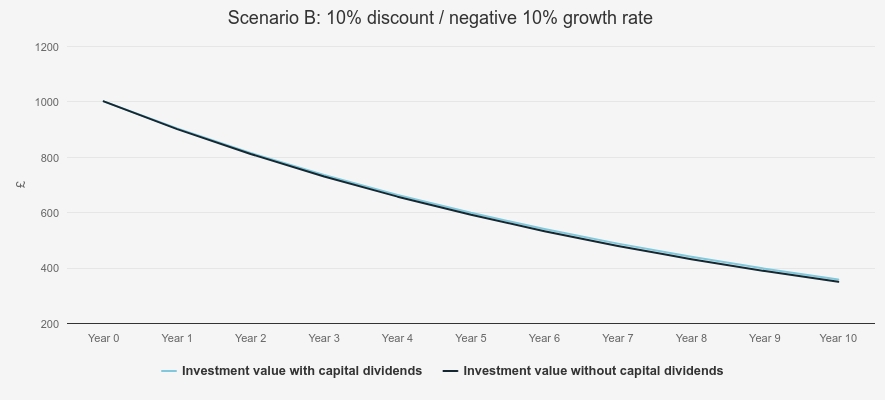
Source: Kepler
Both scenarios show that reinvesting capital dividends can, incrementally, increase the value of the investment. The differences are small though, and one might therefore simply conclude that there really isn’t anything to fear from them. We discuss it further on, but the mathematics unravels when a trust trades at a premium, but the unravelling is so slight it’s probably not worth worrying about.
What about selling some shares instead?
There have been many attempts over the years to persuade investors that, rather than seeking dividends, they should consider selling a few shares every year. We know at Kepler that if we put ‘income’ in the title of an event, it will usually be well-attended and so it’s probably fair to say that that technique isn’t widely practised. Space prevents us from running through all the arguments for and against, but broadly it’s the same as for capital dividends: you can own companies that are more focused on growth and might end up better off that way. But since we’ve built a little spreadsheet, we may as well run another scenario, where we take those same two identical investment trusts and look at the returns if one takes an income from them either through capital dividends or by selling shares. Again, the Scenario C chart below shows the value of the investment over a decade, and again, the capital dividend gives a better outcome. In this case, an identical amount of income has been taken and spent elsewhere for both trusts, and the chart is plotting the remaining value of the shares.
With more on discounts and premiums below, for this specific scenario, we’ll just say that it will be better to sell shares on a premium to raise income rather than receive a capital dividend. But if a discount persists, the difference is actually a little more compelling than in the first two scenarios.
Scenario C
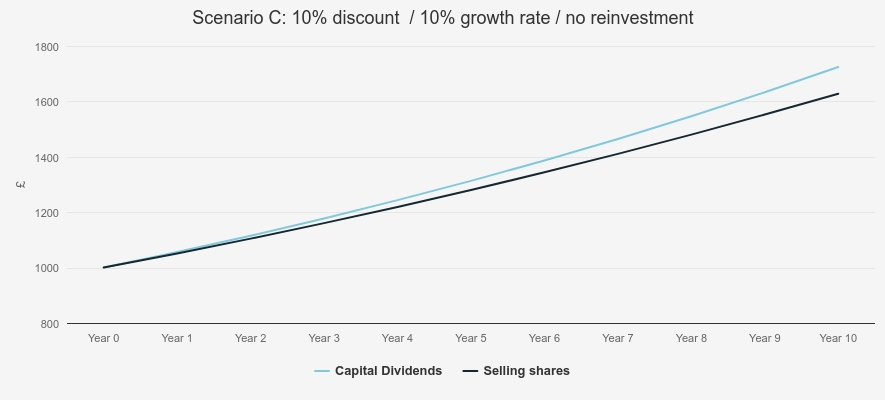
Source: Kepler
What about discounts? And premiums?
There’s a danger once you’ve built a spreadsheet to prove a simple point that you dive off into dozens of other scenarios and lose sight of the main conclusion. Further, the more variables built into a model, the more the result becomes opinion. So, we’ve avoiding modelling narrowing discounts, or volatility or any of the other discount-related factors and just kept our discount at a constant to illustrate the underlying maths of reinvesting capital dividends. But let’s briefly think about discounts. In our example above we have two investment trusts only distinguished by their dividend policy. Over a ten-year period, which one is more likely to see its discount narrow? I think if a trust is paying a dividend, it will increase the chances it attracts more investors. But even if it doesn’t, if some of its existing investors automatically reinvest their dividends, then this creates slightly more demand for the shares. The golden answer to the age-old question ‘how do you narrow a discount?’ is to create more demand for the shares. So, I think, absent other factors such as good marketing, the trust paying the capital dividend has a higher probability of narrowing its discount.
This leads to the next question, which is if a trust goes to a premium, how does the maths of reinvesting dividends work then? The straightforward answer is that it doesn’t, because the investor is then, in effect, being handed a little piece of the NAV and using it to pay a higher price for the shares. I would make three points though. First, the discount has narrowed from 10% and then gone on to a premium. The returns generated from that will vastly outweigh the little compounding effect of dividend reinvesting and that’s a cause for celebration. Second, one can choose to stop reinvesting dividends at that point. Spend the money or reinvest it in something else. Third, history says that most investment trusts are much better at limiting premiums to low single digits than they are discounts. The maths of reinvesting a capital dividend at a tiny premium is, technically, unappealing, but the numbers are so small it’s probably not worth worrying about it. But of course, it’s one more thing to keep an eye on.
Let's clear something up about revenue reserves
If none of that leaves readers persuaded, let’s think about it a different way. One of the oft-cited advantages of investment trusts are their ability to smooth dividends, using revenue reserves. I think this is, uncontroversially, a good thing. But know this. Revenue reserves are not, as the name perhaps implies, a stash of cash in a bank account. When an investment trust transfers some of its income to reserves, it becomes part of the net asset value, invested in the same portfolio. There is no special ring-fenced area where reserves are held. Revenue reserves are an accounting construct that keeps track of how much income the trust has received but hasn’t distributed, but the money is invested just like all the other money. So, if one purchases an investment trust with a large revenue reserve, that value is in the NAV and by extension the share price. So, the same argument that naysayers apply to capital dividends applies: the investor is being given money back that they’ve paid for. The difference is that the original source of that money was from portfolio company dividends, and again, that’s something that might matter to an investor. But if an investment trust with an NAV of 100p pays a dividend of 1p from revenue reserves, then the NAV is now 99p. Just like a capital dividend. Happily, all the other positive maths we’ve explored above also applies.
A few of the good ones...
Many investment trusts pay capital dividends and that tells us something important. While there are those investors who don’t like them, many do and are happy to receive them whether they have created an excel spreadsheet to prove they work or not. A portfolio built for income can only be helped by some diversification into key areas that, without capital dividends, an investor might not be able to access. This year, European equities have notably outperformed US equities and one of the strongest performing trusts in the Europe sector, JPMorgan European Growth & Income Ord (LSE:JEGI) pays a dividend equivalent to 4% of NAV. JEGI’s objective is to be a risk-controlled ‘core’ investment and so although it does not seek out dividend paying companies, it is managed in a way that may well align with conservative equity income investors. In the adjacent European Smaller Companies sector, the aptly named The European Smaller Companies Trust PLC (LSE:ESCT) is in the process of adopting a capital dividend policy paying 6% of NAV. In keeping with the times, ESCT is absorbing one of its smaller rivals, European Assets Ord (LSE:EAT), which holds the record as the longest-running capital dividend payer and ESCT is adopting a similar policy, set at 5% of NAV. This will be a great way to get access to one of the best smaller companies trusts there is while receiving a dividend. Income investors who feel they are shut out from the long-term growth of China could do well to look at JPMorgan China Growth & Income Ord (LSE:JCGI), which pays a dividend at the 4% of NAV rate. And drilling into more specific sectors, International Biotechnology Ord (LSE:IBT) also pays a 4% dividend, and Polar Capital Global Financials Ord (LSE:PCFT) has very recently adopted the same policy, again providing income investors with something they might otherwise not be able to access.
In conclusion
The elephant in the room is that capital dividends are not progressive dividends that gently increase each year, and an income investor needs to think about that. But in building a portfolio of several income trusts, the risk that the capital dividend might fall in a given year is balanced by the fact that it equally might increase significantly. The basic premise of investing in equities is, in any case, that their value rises over time, so taken on a 10-year view, one might see shorter-term volatility as a risk worth taking. The other, perhaps less expected, conclusion is that for investors who don’t care at all about dividends, buying a trust on a discount that pays a capital dividend might be a good thing, partly for the maths we explore above and partly for the increased probability of discount narrowing. Really, it’s as simple as breathing.
Kepler Partners is a third-party supplier and not part of interactive investor. Neither Kepler Partners or interactive investor will be responsible for any losses that may be incurred as a result of a trading idea.
These articles are provided for information purposes only. Occasionally, an opinion about whether to buy or sell a specific investment may be provided by third parties. The content is not intended to be a personal recommendation to buy or sell any financial instrument or product, or to adopt any investment strategy as it is not provided based on an assessment of your investing knowledge and experience, your financial situation or your investment objectives. The value of your investments, and the income derived from them, may go down as well as up. You may not get back all the money that you invest. The investments referred to in this article may not be suitable for all investors, and if in doubt, an investor should seek advice from a qualified investment adviser.
Full performance can be found on the company or index summary page on the interactive investor website. Simply click on the company's or index name highlighted in the article.
Important Information
Kepler Partners is not authorised to make recommendations to Retail Clients. This report is based on factual information only, and is solely for information purposes only and any views contained in it must not be construed as investment or tax advice or a recommendation to buy, sell or take any action in relation to any investment.
This report has been issued by Kepler Partners LLP solely for information purposes only and the views contained in it must not be construed as investment or tax advice or a recommendation to buy, sell or take any action in relation to any investment. If you are unclear about any of the information on this website or its suitability for you, please contact your financial or tax adviser, or an independent financial or tax adviser before making any investment or financial decisions.
The information provided on this website is not intended for distribution to, or use by, any person or entity in any jurisdiction or country where such distribution or use would be contrary to law or regulation or which would subject Kepler Partners LLP to any registration requirement within such jurisdiction or country. Persons who access this information are required to inform themselves and to comply with any such restrictions. In particular, this website is exclusively for non-US Persons. The information in this website is not for distribution to and does not constitute an offer to sell or the solicitation of any offer to buy any securities in the United States of America to or for the benefit of US Persons.
This is a marketing document, should be considered non-independent research and is subject to the rules in COBS 12.3 relating to such research. It has not been prepared in accordance with legal requirements designed to promote the independence of investment research.
No representation or warranty, express or implied, is given by any person as to the accuracy or completeness of the information and no responsibility or liability is accepted for the accuracy or sufficiency of any of the information, for any errors, omissions or misstatements, negligent or otherwise. Any views and opinions, whilst given in good faith, are subject to change without notice.
This is not an official confirmation of terms and is not to be taken as advice to take any action in relation to any investment mentioned herein. Any prices or quotations contained herein are indicative only.
Kepler Partners LLP (including its partners, employees and representatives) or a connected person may have positions in or options on the securities detailed in this report, and may buy, sell or offer to purchase or sell such securities from time to time, but will at all times be subject to restrictions imposed by the firm's internal rules. A copy of the firm's conflict of interest policy is available on request.
Past performance is not necessarily a guide to the future. The value of investments can fall as well as rise and you may get back less than you invested when you decide to sell your investments. It is strongly recommended that Independent financial advice should be taken before entering into any financial transaction.
PLEASE SEE ALSO OUR TERMS AND CONDITIONS
Kepler Partners LLP is a limited liability partnership registered in England and Wales at 9/10 Savile Row, London W1S 3PF with registered number OC334771.
Kepler Partners LLP is authorised and regulated by the Financial Conduct Authority.
Editor's Picks