eyeQ: analysing upside potential at JD Wetherspoon
Experts at eyeQ have used AI and their own smart machine to analyse macro conditions and generate actionable trading signals. Here’s its view on the discount pub chain.
23rd July 2025 10:44
Huw Roberts from eyeQ

“Our signals are crafted through macro-valuation, trend analysis, and meticulous back-testing. This combination ensures a comprehensive evaluation of an asset's value, market conditions, and historical performance.” eyeQ
- Discover: eyeQ analysis explained | eyeQ: our smart machine in action | Glossary
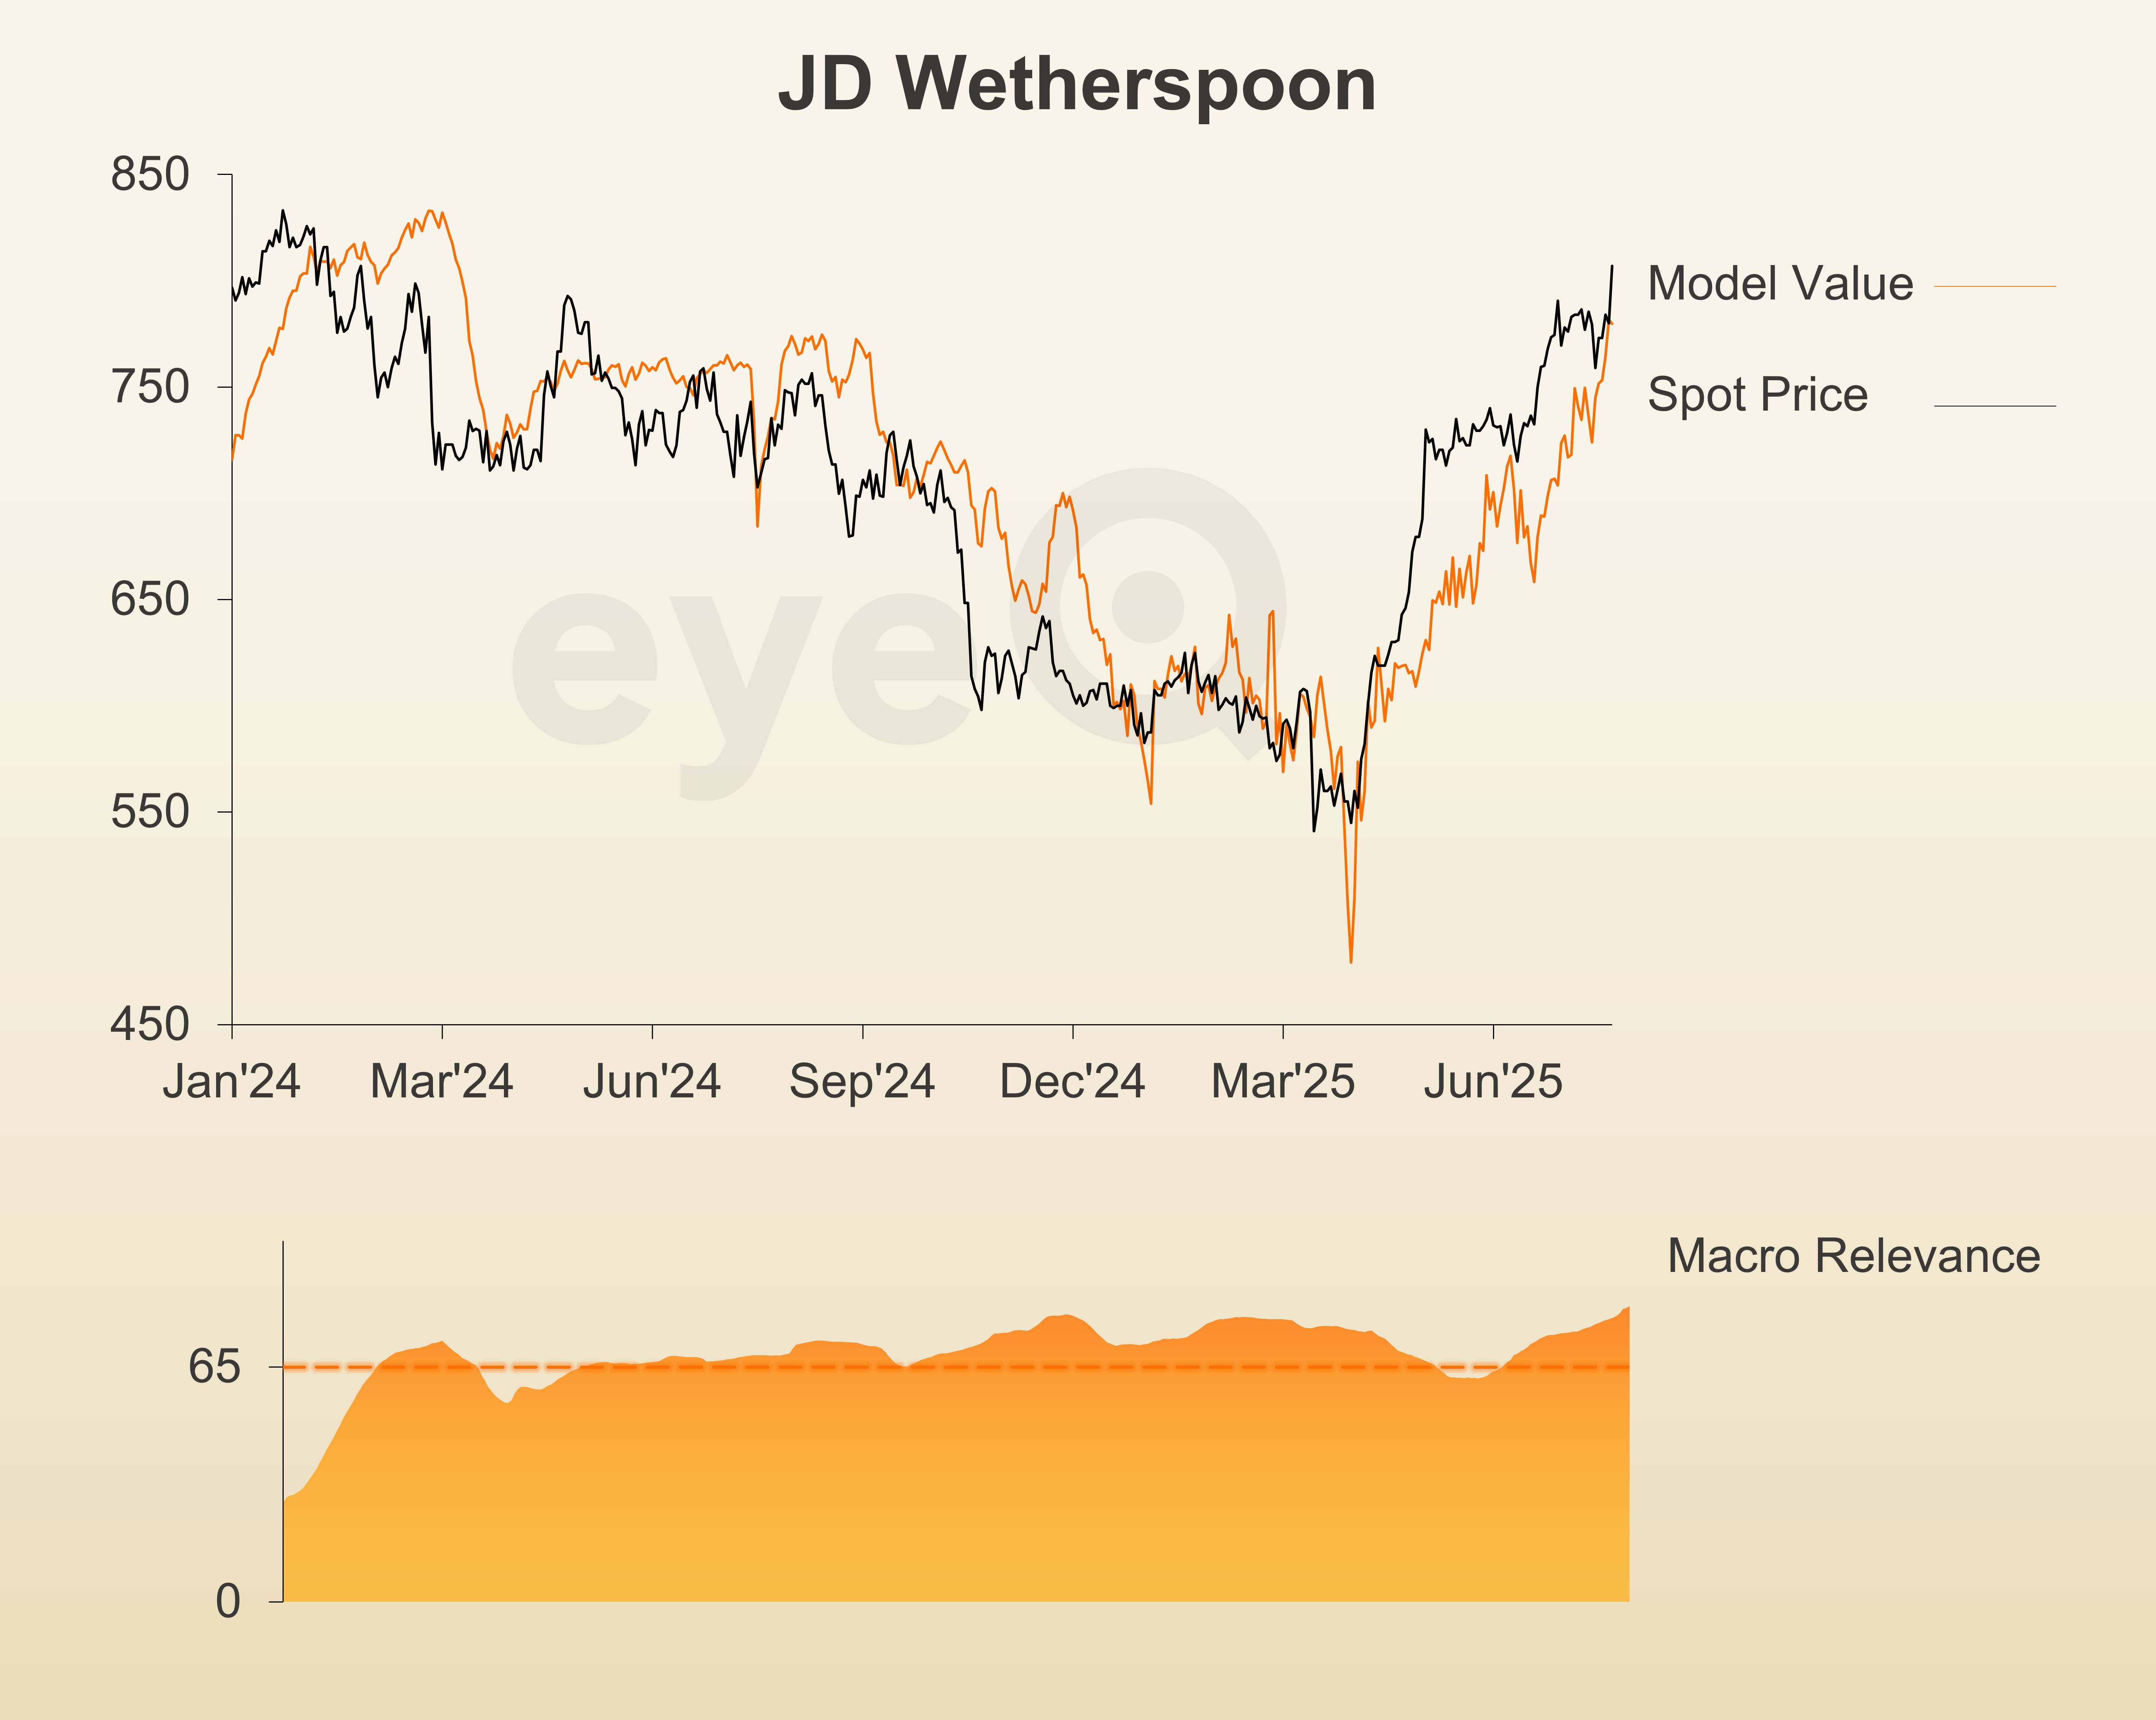
JD Wetherspoon
Macro Relevance: 82%
Model Value: 779.78p
Fair Value Gap: +3.37% premium to model value
Data correct as at 23 July 2025. Please click glossary for explanation of terms. Long-term strategic model.
Pub chains Marston's (LSE:MARS) and Fuller Smith & Turner Class A (LSE:FSTA) had already produced positive trading updates recently. Today, Wetherspoon (J D) (LSE:JDW) added to the cheer with like-for-like sales rising 5.1% over the past three months.
It wasn’t that long ago that the story dominating the hospitality trade was that tax hikes and increased labour costs were going to be a big drag on performance. But, thanks to the hot weather, ’Spoons chair Tim Martin noted that volumes have now overtaken pre-pandemic levels.
So, it’s all good news now?
Sort of. The good news is that macro conditions are improving - eyeQ model value is in a strong uptrend, rising 13.4% in the last month alone. It’s also noticeable that JDW compares favourably in this regard versus its peers. Over the last month, eyeQ model value for MARS is down 0.6% and FSTA model value is down 9.6%.
However, the recent rally has run slightly ahead of that, and the stock now sits 3.4% rich on our metrics. That’s not a big valuation gap - it’s nowhere near enough to trigger a bearish signal. But equally it does suggest that these aren’t great levels to chase the rally.
While the broad macro environment suits JDW over other pub chains, these aren’t optimal entry levels.
Source: eyeQ. Past performance is not a guide to future performance.
Useful terminology:
Model value
Where our smart machine calculates that any stock market index, single stock or exchange-traded fund (ETF) should be priced (the fair value) given the overall macroeconomic environment.
Model (macro) relevance
How confident we are in the model value. The higher the number the better! Above 65% means the macro environment is critical, so any valuation signals carry strong weight. Below 65%, we deem that something other than macro is driving the price.
Fair Value Gap (FVG)
The difference between our model value (fair value) and where the price currently is. A positive Fair Value Gap means the security is above the model value, which we refer to as “rich”. A negative FVG means that it's cheap. The bigger the FVG, the bigger the dislocation and therefore a better entry level for trades.
Long Term model
This model looks at share prices over the last 12 months, captures the company’s relationship with growth, inflation, currency shifts, central bank policy etc and calculates our key results - model value, model relevance, Fair Value Gap.
These third-party research articles are provided by eyeQ (Quant Insight). interactive investor does not make any representation as to the completeness, accuracy or timeliness of the information provided, nor do we accept any liability for any losses, costs, liabilities or expenses that may arise directly or indirectly from your use of, or reliance on, the information (except where we have acted negligently, fraudulently or in wilful default in relation to the production or distribution of the information).
The value of your investments may go down as well as up. You may not get back all the money that you invest.
Equity research is provided for information purposes only. Neither eyeQ (Quant Insight) nor interactive investor have considered your personal circumstances, and the information provided should not be considered a personal recommendation. If you are in any doubt as to the action you should take, please consult an authorised financial adviser.
Disclosure
We use a combination of fundamental and technical analysis in forming our view as to the valuation and prospects of an investment. Where relevant we have set out those particular matters we think are important in the above article, but further detail can be found here.
Please note that our article on this investment should not be considered to be a regular publication.
Details of all recommendations issued by ii during the previous 12-month period can be found here.
ii adheres to a strict code of conduct. Contributors may hold shares or have other interests in companies included in these portfolios, which could create a conflict of interests. Contributors intending to write about any financial instruments in which they have an interest are required to disclose such interest to ii and in the article itself. ii will at all times consider whether such interest impairs the objectivity of the recommendation.
In addition, individuals involved in the production of investment articles are subject to a personal account dealing restriction, which prevents them from placing a transaction in the specified instrument(s) for a period before and for five working days after such publication. This is to avoid personal interests conflicting with the interests of the recipients of those investment articles.
Editor's Picks