How to mix and match investment trusts
Kepler examines key developed-market equity sectors and highlights large-cap/small-cap investment trust combinations.
7th March 2025 14:02

This content is provided by Kepler Trust Intelligence, an investment trust focused website for private and professional investors. Kepler Trust Intelligence is a third-party supplier and not part of interactive investor. It is provided for information only and does not constitute a personal recommendation.
Material produced by Kepler Trust Intelligence should be considered a marketing communication, and is not independent research.
In Shakespeare’s Macbeth, Lady Macbeth is arguably the driving force behind her husband’s rise to the throne. While Macbeth harbours the ambition to become king, he is morally conflicted about committing regicide. His hesitation and lack of resolve are counterbalanced by Lady Macbeth’s strong will and absence of moral scruples. It is doubtful that Macbeth would have dared to murder King Duncan if he and Lady Macbeth had shared the same personality traits. Thus, it is the contrast in mindset between the two, and their differing reactions to a given situation, that enables the events to unfold.
- Invest with ii: Invest in Investment Trusts | Top UK Shares | Interactive investor Offers
While portfolio construction may not carry the same thrill as the prospect of becoming king of Scotland, the lesson from Macbeth suggests that, just as Lady Macbeth’s determination compensated for her husband’s scruples, investors may want their investments to complement each other — compensating when the other falters. This is also relevant when combining large-cap and small-cap funds within the same geography. Although different market capitalisations offer some diversification, both funds may still rise and fall together if they share exposure to similar factors or sector biases. To further enhance diversification, investors might consider pairing a large-cap strategy with a small-cap specialist that has a low correlation.
For that purpose, we have examined the key developed-market equity sectors, all of which have corresponding smaller companies sectors, to identify large-cap/small-cap investment trust pairings with the lowest correlation in each region. All correlations are calculated over a five-year period (to 31 January 2025), which is the industry standard for performance data and arguably provides sufficient time for strategies to play out.
Home production
As Macbeth takes place in Scotland and was written by an English playwright, it is perhaps appropriate to start with the UK. We looked at the trusts in the income and growth sectors and calculated the correlations with the small-cap trusts, excluding some oddities which we think aren’t true UK small-cap strategies.
The weakest correlation we observed is between Finsbury Growth & Income Ord (LSE:FGT) from the AIC UK Equity Income sector and Rockwood Strategic Ord (LSE:RKW) from the AIC UK Smaller Companies sector, with a correlation of just 0.05. However, this unusually low correlation comes with a caveat: RKW moved fully into cash between 31/03/2023 and 31/08/2023, distorting its five-year NAV performance. Over a one-year period (to 31/01/2025), the two strategies are negatively correlated, suggesting that they have tended to move in opposite directions. However, as one year is a short-term period, we believe investors should not draw definitive conclusions from this.
The next lowest correlation we identified, at 0.54, also involves FGT but is paired with River UK Micro Cap Ord (LSE:RMMC). The two strategies operate at opposite ends of the UK equity market cap spectrum: FGT holds FTSE 100 companies, typically with international revenues, whereas RMMC, like RKW, focusses on companies with a market capitalisation below £150 million, which are likely more exposed to the UK domestic economy. We think these numbers highlight the attractive properties of investing in micro-caps, where company specifics are much more important and so good performance can be generated with less dependence on market direction.
The investment philosophies of FGT and RMMC also differ. Nick Train, the manager of FGT, invests in high-quality companies and holds them for very long periods of time to benefit from the effects of compounding. For example, data from Morningstar shows that Nick has held London Stock Exchange Group (LSE:LSEG), RELX (LSE:REL), and Diageo (LSE:DGE) since 30/09/2007, which perhaps illustrates his long-term investment philosophy. In contrast, George Ensor, the manager of RMMC, seeks to take advantage of the illiquidity risk premium that micro-caps are often subject to. He buys micro-caps with high-quality or high-growth characteristics, which are typically too small for institutional investors. He then holds these companies until their market capitalisation grows to between £100 million and £200 million, at which point they become investible for institutional investors, often leading to a re-rating of their shares. Therefore, the low correlation between FGT and RMMC is likely explained by the difference in investment strategies and liquidity profiles.
As FGT is a constituent of the AIC UK Equity Income sector, we have also examined the combination of a strategy from the AIC UK All Companies sector and one from the AIC UK Smaller Companies sector that offers the lowest correlation. In this case, RMMC is included again, but this time paired with Aurora UK Alpha Ord (LSE:ARR), resulting in a correlation of 0.69. ARR invests in companies that manager Gary Channon considers to be good businesses, run by strong management teams, and whose stocks are available at attractive valuations, across the entire UK equity market capitalisation spectrum. The portfolio is concentrated, typically holding 15 to 20 stocks, and individual stocks can have a sizeable weight in the portfolio. For example, Barratt Redrow (LSE:BTRW), Frasers Group (LSE:FRAS), and Castelnau Group Ord (LSE:CGL) together account for circa 45% of the portfolio (as of 31/01/2025), meaning these specific stocks will have a large influence on ARR’s NAV performance. As such, we believe that the differences in investment philosophies between ARR and RMMC, as well as ARR’s concentrated portfolio with heavy stock-specific weights, have resulted in a lower correlation compared to pairings involving other constituents of the AIC UK All Companies and AIC UK Smaller Companies sectors.
On the global stage
While Macbeth is part of the British theatrical tradition, adaptations have located it in Mumbai, Pennsylvania, and Melbourne among other places, and it has been reimagined by globally renowned directors such as Polanski and Kurosawa.
When looking at the AIC Global and AIC Global Smaller Companies sectors, the pairing with the lowest correlation, at 0.33, is Manchester & London Ord (LSE:MNL) and the The Global Smaller Companies Trust Ord (LSE:GSCT). While MNL belongs to the AIC Global sector, we would argue that it is more akin to a technology specialist, with 91.7% of its portfolio invested in the information technology sector (as of 28/01/2025), and an almost exclusive exposure to the US (circa 95% of the portfolio). MNL also takes concentrated positions in specific names, such as NVIDIA Corp (NASDAQ:NVDA) and Microsoft Corp (NASDAQ:MSFT), which make up 36% and 25.5% of the portfolio, respectively. In contrast, GSCT is more diversified across sectors and geographies, with manager Nish Patel defining his investment style as “quality value”—selecting high-quality companies while also being sensitive to valuations. Given MNL’s strong sector bias and the different approaches to valuation, we believe the moderate correlation between MNL and GSCT should persist, with both strategies serving distinct roles within a portfolio.
The pairing with the weakest correlation between a strategy from the AIC Global Equity Income sector and one from the AIC Global Smaller Companies sector consists of STS Global Income & Growth Trust Ord (LSE:STS) and Edinburgh Worldwide Ord (LSE:EWI), with a correlation of 0.48. STS aims to provide investors with a rising income and long-term capital growth through a portfolio of global companies with strong balance sheets, capable of delivering sustainable dividend growth, and high returns on capital. In comparison, EWI invests in relatively early stage companies that manager Douglas Brodie and Baillie Gifford’s Discovery Team believe have the potential to disrupt industries or create new markets, giving EWI a high-risk-reward profile. This contrast in philosophies — STS favouring stability and robustness, while EWI focusses on future potential — may explain the moderate correlation between the two strategies, although it is true that EWI’s exposure to unlisted businesses will naturally lower its correlation to a portfolio solely made up of listed securities. With EWI aiming to revamp its approach to place more emphasis on the financial resilience of its investee companies, we think it could impact its NAV performance and, in turn, influence the correlation with STS. However, EWI’s strategy will remain focussed on high growth, meaning that its philosophy will likely stay significantly distinct from STS’s.
FIVE-YEAR PERFORMANCE
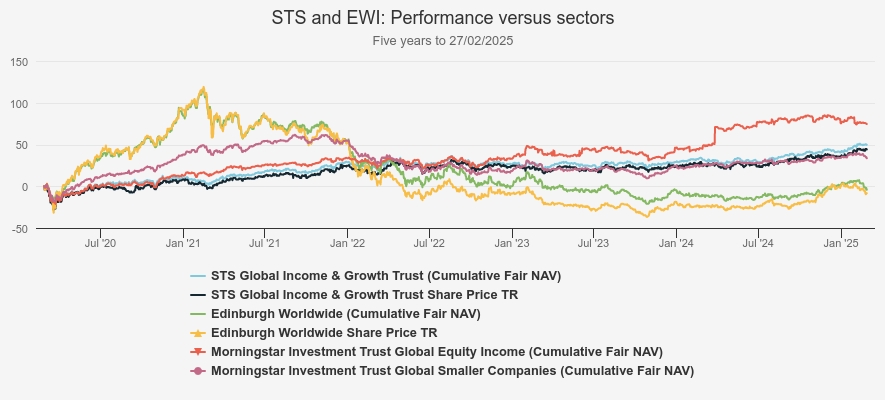
Source: Morningstar. Past performance is not a reliable indicator of future results
The Hollywood remake
According to Wikipedia, there have been over 45 screen adaptations of Macbeth since 1905, with about a dozen originating from the US, including the two earliest attempts. For those seeking a low-correlation large-cap/small-cap pairing in the US, the best combination we have identified is Pershing Square Holdings Ord (LSE:PSH) and Brown Advisory US Smaller Companies Ord (LSE:BASC), with a correlation of 0.42.
A first observation is that PSH has a much more concentrated portfolio, consisting of only 13 holdings (as of 31/12/2024), whereas BASC typically holds circa 80 stocks. The investment approaches also differ greatly. Bill Ackman, PSH’s manager, seeks businesses that generate predictable and growing free cash flows, operate in industries with strong barriers to entry, and trade at a discount to intrinsic value. Then, they want their investee companies to have the potential to improve, which can be encouraged through engagement. Historically, PSH has also employed derivative strategies, notably to hedge the portfolio against major sell-offs. In contrast, BASC is a long-only strategy, with manager Chris Berrier looking for companies leading (or gaining market share) in large or growing industries, managed by transparent, capable, and shareholder-friendly teams, and with the capacity to deliver unique value propositions to customers and to achieve a competitive advantage. Thus, we could argue that PSH is more of a special situations fund, where improvement from the investee companies and engagement from the portfolio manager are key drivers of returns, whereas BASC could be qualified as a ‘quality growth’ strategy. Given these differences, we believe PSH and BASC each contribute differently to a portfolio. That said, we would also highlight that PSH’s correlation with JPMorgan US Smaller Companies Ord (LSE:JUSC), the other constituent of the AIC North American Smaller Companies sector, is only marginally higher, at 0.45. Similarly to BASC, JUSC invests in US small-caps with a quality growth bias, and so, many of the points made about the differences between PSH and BASC also hold when comparing the former to JUSC.
FIVE-YEAR PERFORMANCE
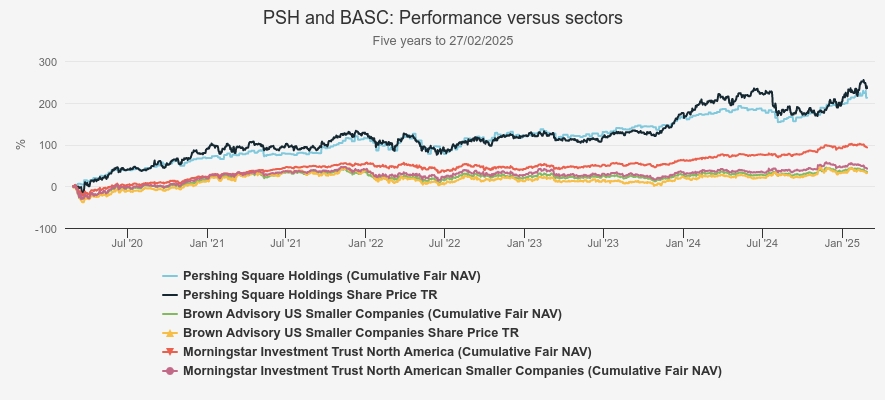
Source: Morningstar. Past performance is not a reliable indicator of future results
We also note that Baillie Gifford US Growth Ord (LSE:USA) exhibits relatively low correlations with US small-cap-focused investment trusts compared to its peers in the AIC North America sector, as the bar chart below shows. For instance, it has a correlation of 0.61 with JUSC and 0.69 with BASC. A key factor contributing to this lower correlation could be USA's significant private equity exposure, which accounts for circa 35% of its portfolio (as of 31/12/2024).
Private equities are not valued as frequently as publicly listed equities, which often leads to differences in how these two asset classes behave. Moreover, USA has a strong high-growth bias, focusing on companies with the potential for rapid revenue growth, but that may have little to show in terms of earnings in the short term. This contrasts with JUSC and BASC, which invest in companies that are already profitable and should be able to sustain their growth in a more stable and predictable manner. In our view, these differences in investment styles and USA’s significant private equity holdings mean that the correlation between USA and the US small-cap strategies could remain moderate over time.
CORRELATION
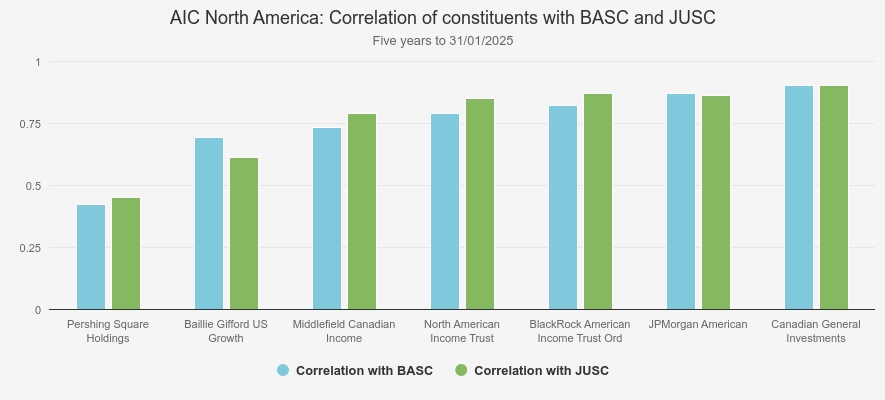
Source: Morningstar
The European tour
While Macbeth may have to compete with domestic works like Goethe’s Faust in Germany or Dante’s The Divine Comedy in Italy, it remains well-known, and performances of Macbeth in European theatres are not uncommon.
In the European context, the large-cap/small-cap pairing offering the lowest correlation is the Henderson European Trust Ord (LSE:HET) and Montanaro European Smaller Companies (MET) duo, with a correlation of 0.76. However, there are two important caveats to this pairing. First HET is a new strategy, which was formed in July 2024 out of the merger of Henderson European Focus Trust (HEFT) and Henderson EuroTrust (HNE). As HEFT absorbed the assets of HNE, a significant portion of HET’s five-year performance reflects HEFT's historical performance. Second, in early February, HET’s board announced the resignation of Tom O’Hara and Jamie Ross, with Robert Schramm-Fuchs and Nick Sheridan replacing them. As a result, the future evolution of the strategy remains uncertain.
The next pairing offering the lowest correlation in Europe consists of Fidelity European Trust Ord (LSE:FEV) and European Assets Ord (LSE:EAT), at 0.77. As with the previous combination, this correlation is higher than those observed in other geographies which we would attribute to the tendency of European strategies to favour the quality factor and the absence of highly specialised strategies as we see in the AIC North America sector in the likes of PSH, for example. That said, there are nuances in the investment approach of the two strategies. For instance, FEV invests with a risk-averse mindset and focuses on companies that can generate higher returns on capital and crucially a sustainably growing dividend. In contrast, EAT puts an emphasis on high-quality companies with strong market positions but integrates themes such as energy transition, digitalisation, and deglobalisation to inform stock picking. As such, we believe that FEV and EAT could be an interesting combination, with EAT offering exposure to the growth potential of European smaller companies, while FEV’s defensive features could provide a ballast in the portfolio.
FIVE-YEAR PERFORMANCE
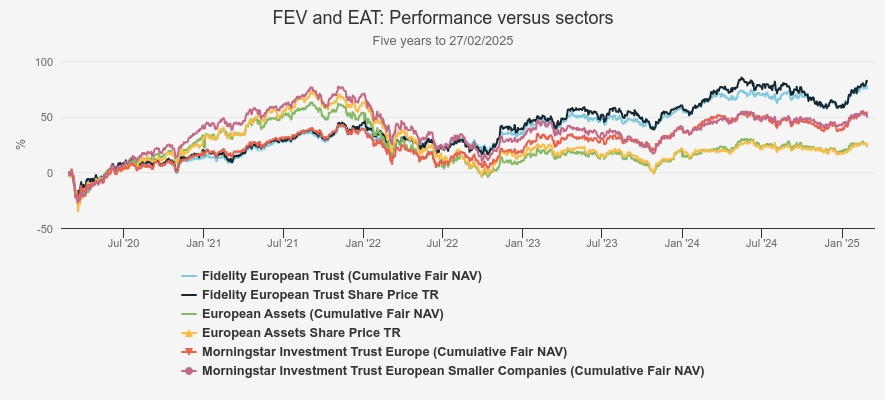
Source: Morningstar. Past performance is not a reliable indicator of future results
Final bow
Regardless of correlations, we believe that the closed-end structure gives investment trusts an advantage over open-ended funds. This structure allows them to explore a broader spectrum of market capitalisation, including areas where open-ended funds may face liquidity issues. For example, RMMC’s strategy would likely be difficult to implement in an open-ended fund. In fact, its manager George Ensor manages an open-ended strategy called the RGI UK Listed Smaller Companies Fund, which, according to Morningstar, includes some mid-cap stocks. However, RMMC is exclusively invested in small-caps (as of 31/01/2025). This capacity to invest in the smallest companies may help create combinations of large-cap and small-cap strategies with lower correlation, as less liquid stocks may behave differently from large-cap stocks or even mid- and larger small-caps.
This observation also applies to other less liquid assets, such as private equities. For example, Baillie Gifford American, managed by the same team as USA, does not hold unlisted assets. Therefore, the closed-end structure allows investment trusts to diversify beyond traditional assets, leading to a different performance profile.
Finally, we would argue that, despite typically having fewer constituents than their Investment Association equivalents, the AIC sectors offer a wealth of differentiated strategies. For example, we are not aware of any open-ended strategy that is equivalent to PSH or shares similarities with it. As such, investment trusts provide investors with numerous opportunities to create combinations that exhibit moderate, or even weak, correlations.
Kepler Partners is a third-party supplier and not part of interactive investor. Neither Kepler Partners or interactive investor will be responsible for any losses that may be incurred as a result of a trading idea.
These articles are provided for information purposes only. Occasionally, an opinion about whether to buy or sell a specific investment may be provided by third parties. The content is not intended to be a personal recommendation to buy or sell any financial instrument or product, or to adopt any investment strategy as it is not provided based on an assessment of your investing knowledge and experience, your financial situation or your investment objectives. The value of your investments, and the income derived from them, may go down as well as up. You may not get back all the money that you invest. The investments referred to in this article may not be suitable for all investors, and if in doubt, an investor should seek advice from a qualified investment adviser.
Full performance can be found on the company or index summary page on the interactive investor website. Simply click on the company's or index name highlighted in the article.
Important Information
Kepler Partners is not authorised to make recommendations to Retail Clients. This report is based on factual information only, and is solely for information purposes only and any views contained in it must not be construed as investment or tax advice or a recommendation to buy, sell or take any action in relation to any investment.
This report has been issued by Kepler Partners LLP solely for information purposes only and the views contained in it must not be construed as investment or tax advice or a recommendation to buy, sell or take any action in relation to any investment. If you are unclear about any of the information on this website or its suitability for you, please contact your financial or tax adviser, or an independent financial or tax adviser before making any investment or financial decisions.
The information provided on this website is not intended for distribution to, or use by, any person or entity in any jurisdiction or country where such distribution or use would be contrary to law or regulation or which would subject Kepler Partners LLP to any registration requirement within such jurisdiction or country. Persons who access this information are required to inform themselves and to comply with any such restrictions. In particular, this website is exclusively for non-US Persons. The information in this website is not for distribution to and does not constitute an offer to sell or the solicitation of any offer to buy any securities in the United States of America to or for the benefit of US Persons.
This is a marketing document, should be considered non-independent research and is subject to the rules in COBS 12.3 relating to such research. It has not been prepared in accordance with legal requirements designed to promote the independence of investment research.
No representation or warranty, express or implied, is given by any person as to the accuracy or completeness of the information and no responsibility or liability is accepted for the accuracy or sufficiency of any of the information, for any errors, omissions or misstatements, negligent or otherwise. Any views and opinions, whilst given in good faith, are subject to change without notice.
This is not an official confirmation of terms and is not to be taken as advice to take any action in relation to any investment mentioned herein. Any prices or quotations contained herein are indicative only.
Kepler Partners LLP (including its partners, employees and representatives) or a connected person may have positions in or options on the securities detailed in this report, and may buy, sell or offer to purchase or sell such securities from time to time, but will at all times be subject to restrictions imposed by the firm's internal rules. A copy of the firm's conflict of interest policy is available on request.
Past performance is not necessarily a guide to the future. The value of investments can fall as well as rise and you may get back less than you invested when you decide to sell your investments. It is strongly recommended that Independent financial advice should be taken before entering into any financial transaction.
PLEASE SEE ALSO OUR TERMS AND CONDITIONS
Kepler Partners LLP is a limited liability partnership registered in England and Wales at 9/10 Savile Row, London W1S 3PF with registered number OC334771.
Kepler Partners LLP is authorised and regulated by the Financial Conduct Authority.
Editor's Picks