ii investment performance review: Q2 2024
Investors had to reconsider their expectations on interest rate cuts, while the UK bounced back from recession.
11th July 2024 12:41

Market round-up
Global equities were much more subdued in Q2 having returned 2.8% against a 9.2% rise seen in Q1. Meanwhile, global bonds fell 1.2% as concerns about US inflation at the start of the quarter caused investors to reconsider their expectations on interest rate cuts.
In Europe, despite the European Central Bank (ECB) moving ahead with a 25 basis point rate cut in early June, European yields rose on stickier-than-expected inflation, the fallout from the EU parliamentary elections and the resultant announcement of a snap election in France.
- Invest with ii: What is a Managed ISA? | Open a Managed ISA | Transfer an ISA
Having experienced a technical recession in the second half of 2023, the UK rebounded in Q1 having recorded GDP growth of 0.7%, although recent data suggests that growth stagnated in April. The latest inflation numbers came in at the 2% target for the first time since July 2021, with the Bank of England (BoE) continuing to preach caution as services inflation, although falling, remains high with wage growth being a key driver.
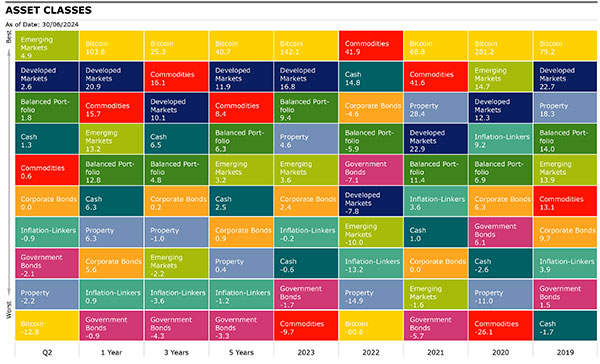
Source: Morningstar as of 30th June 2024. Total Returns in GBP. Developed Markets: MSCI World, Emerging Markets: MSCI EM, Corporate Bonds: Bloomberg Global Aggregate Corporate, Commodities: S&P GSCI, Property: FTSE EPRA Nareit Developed, Inflation-Linkers: Bloomberg Global Inflation Linked, Government Bonds: Bloomberg Global Treasury, Bitcoin: MarketVector Bitcoin, Balanced Portfolio: FTSE UK Private Investor Balanced, Cash: ICE LIBOR 1 Month.
*Please note the Hedge Funds Index has been removed for Q2 as the previously used Morningstar Broad Hedge Fund TR index has been discontinued*
Shares
Global equities, as measured by the MSCI ACWI, rose 2.80% in Q2 with emerging markets (EM) outperforming developed markets (DM) having risen 4.93% and 2.56% respectively.
UK shares outperformed relative to global equities as the FTSE All-Share index increased 3.7% over the period as economic conditions improved. Telecoms (11.2%), financials (6.8%) and basic materials (6.6%) were the predominant drivers of returns. Within telecoms, BT Group (LSE:BT.A) was a notable performer as its shares surged as the markets received its cost-transformation plan warmly. The main detractors were consumer discretionary (-1.3%) and utilities (-1.1%), the two sectors that posted negative returns in the UK market.
US equities posted a 4.2% return for the quarter as investors were initially skittish over worries about an overheating US economy, fears which abated as the quarter progressed. IT and communication services were the main contributors to positive returns as ongoing enthusiasm surrounding artificial intelligence (AI) continued to be a tailwind. The largest detractors in the US were materials (-4.7%), energy (-2.7%) and real estate (-2.3%), which suffered from the continuing “higher for longer” regime.
- Sign up to our free newsletter for share, fund and trust ideas, and the latest news and analysis
- Fund managers give their take on what Labour's win means for markets
European equities closed the quarter marginally lower (-0.4%), wearied by the fallout of the European parliamentary elections, the subsequent announcement of a snap election in France and uncertainty over the scope of further rate cuts. The healthcare sector (5.7%) and IT (5.1%) led the way with the latter being driven by semiconductor-related stocks. The worst-performing sectors were real estate (-21.7%) and consumer discretionary (-8.1%) where there was weakness in luxury goods and automotives.
Japanese equities underperformed the global market as they fell 4.4% this quarter with a depreciating yen being the major driver of negative returns in sterling. Earnings season concluded with stronger-than-expected results as Japanese companies saw growth in sales and improved profitability, but market sentiment was ultimately weighed down by conservative earnings guidance for the next year. Corporate governance transformation continued with an increasing number of firms announcing commitments to the Tokyo Stock Exchange’s initiatives.
EM equities rose 4.9%, driven by positive returns in Taiwan (15%), India (9.9%) and China (7%). The sustained AI tailwind continued to benefit the Taiwanese market, while India benefited from continued economic momentum and a positive outlook. Chinese equities locked in strong gains in Q2 as cheap valuations spurred investors to return to the market. Brazil was the notable laggard in EMs having declined 12.3% as it fell foul of the tempering interest rate cut expectations by the Federal Reserve, while flooding in the state of Rio Grande do Sul, in southern Brazil, also weighed on the market.
| Index/market | Q2 (%) | 1 year | 3 years | 5 years |
| FTSE All-Share | 3.73 | 12.98 | 7.40 | 5.54 |
| FTSE 100 | 3.75 | 12.79 | 9.20 | 5.78 |
| FTSE 250 | 3.18 | 13.93 | -0.29 | 3.55 |
| FTSE Small Cap | 6.49 | 14.55 | 0.45 | 7.10 |
| Europe Ex UK | -0.42 | 12.10 | 6.06 | 7.75 |
| S&P 500 | 4.21 | 25.27 | 13.32 | 15.20 |
| Asia Pacific Ex Japan | 6.19 | 13.69 | -1.54 | 4.08 |
| TOPIX Japan | -4.39 | 13.49 | 5.47 | 6.62 |
| Emerging Markets | 4.93 | 13.19 | -2.21 | 3.24 |
| Brazil | -12.30 | -7.15 | 0.15 | -2.00 |
| China | 7.02 | -1.05 | -15.19 | -4.13 |
| India | 10.13 | 35.13 | 16.86 | 13.78 |
| World | 2.56 | 20.88 | 10.07 | 11.93 |
| MSCI ACWI | 2.80 | 20.06 | 8.60 | 10.91 |
| World Growth | 6.13 | 25.41 | 8.67 | 14.00 |
| World Value | -0.65 | 14.57 | 7.94 | 7.17 |
Source: Morningstar as of 30 June 2024. Total Returns in GBP. MSCI ACWI World indexes.
Sectors/Style
Overall, global growth (6.1%) outperformed global value (-0.7%) as an investment style this quarter no doubt driven by the AI theme that has dominated global markets over the past 18 months. However, there are notable regional differences with value outperforming growth in EM (including China and Brazil) and the UK.
In terms of global sector performance, it should not be surprising that IT (11.3%) and communication services (8%) were the main drivers of equity returns in Q2, while materials (-3.2%), industrials (-1.9%) and consumer discretionary (-1.5%) were the worst-performing sectors.
Global large-caps (3.8%) outperformed mid (-2.5%) and small-caps (-1.6%) as large-caps were buoyed by the mega-cap tech names, while smaller companies continue to feel the stress of higher-for-longer interest rates. There are, however, regional variations notably the UK, Europe and EM where small-cap returns outpaced large-caps, with mid-caps seeing the worst performance relatively.
| Sector | Q2 (%) | 1 year | 3 years | 5 years |
| Consumer Discretionary | -1.54 | 9.65 | 0.35 | 8.29 |
| Healthcare | 0.26 | 11.33 | 6.87 | 9.74 |
| Industrials | -1.85 | 15.75 | 8.59 | 9.45 |
| Information Technology | 11.30 | 38.47 | 17.13 | 23.30 |
| Materials | -3.23 | 6.55 | 2.86 | 7.35 |
| Utilities | 3.51 | 7.00 | 6.53 | 4.54 |
| Consumer Staples | -0.25 | 1.83 | 4.36 | 4.74 |
| Financials | 0.07 | 22.73 | 9.39 | 8.13 |
| Energy | -0.86 | 17.31 | 20.55 | 8.20 |
| Communication Services | 8.01 | 32.98 | 3.87 | 9.81 |
Source: Morningstar as of 30 June 2024. Total Returns in GBP. MSCI ACWI World Indexes.
Fixed income
The Bloomberg Global Aggregate Index fell 1.2% in this quarter as yields rose, while investors had to reconsider their expectations for interest rate cuts following renewed concerns over US inflation data. Political risk also drove weakness in some markets including Europe.
Global treasuries (-2.1%) underperformed corporates which ended the quarter flat with high yield (1%) being a bright spot in fixed income. Similarly in the UK, sterling corporates (-0.1%) outperformed gilts (-0.9%) and inflation-linked gilts (-2%).
The US 2-year yield rose from 4.6% to 4.8% over the quarter, with US 10-year yields also rising from 4.3% to 4.4%. UK 2-year yields fell marginally from 4.3% to 4.2%, while 10-year yields rose marginally from 4.1% to 4.2 %.
| Q2 (%) | 1 year | 3 years | 5 years | |
| Global Aggregate | -1.17 | 1.50 | -2.66 | -1.89 |
| Global Government | -2.09 | -0.87 | -4.34 | -3.28 |
| UK Gilts | -0.89 | 4.76 | -8.18 | -4.19 |
| Global Corporate | 0.00 | 5.56 | 0.15 | 0.91 |
| Sterling Corporate | -0.12 | 9.70 | -3.89 | -0.76 |
| EURO Corporate | -0.76 | 5.10 | -2.89 | -1.98 |
| Global Inflation Linked | -0.91 | 0.93 | -3.59 | -1.22 |
| UK Inflation Linked | -2.25 | -0.71 | -12.22 | -6.38 |
| Global High Yield | 0.97 | 12.46 | 3.56 | 2.82 |
Source: Morningstar as of 30June 2024. Total Returns in GBP. Global Aggregate: Bloomberg Global Aggregate, Global Government: Bloomberg Global Treasury, UK Gilts: FTSE Act UK Conventional Gilts All Stocks. Global Corporate: Bloomberg Global Corporate, Sterling Corporate: ICE BofA Sterling Non-Gilt, Euro Corporate: Markit iBoxx EUR, Global High Yield: Bloomberg Global High Yield, Global Inflation Linked: Bloomberg Global Inflation Linked, UK Inflation Linked: Bloomberg Global Inflation Linked UK.
Alternatives
The S&P GSCI saw marginal gains (0.6%) in Q2 with industrial metals (8.2%) and precious metals (6%) being the leading the contributors, offset by losses in agriculture (-7.8%). All industrial metals components saw positive returns with zinc (20%) being a particular bright spot.
Silver led precious metals as it rose 17.7%, with palladium (-3.9%) being a notable laggard. While in agriculture, notable losses included cotton (-20.8%), corn (-10%) and sugar (-7%), while coffee was the bright spot, closing the period 22.5% up.
| Q2 (%) | 1 year | 3 years | 5 years | |
| Global REITs | -2.21 | 6.26 | -0.96 | 0.40 |
| UK REITs | 0.03 | 17.61 | -5.01 | -0.91 |
| Gold | 5.39 | 22.98 | 13.11 | 10.64 |
| Global Infrastructure | 2.60 | 7.63 | 8.76 | 4.47 |
| Global Natural Resources | -1.83 | 8.43 | 9.54 | 8.53 |
| Volatility | -4.45 | -7.94 | -4.95 | -3.65 |
| Cash | 1.32 | 6.29 | 6.48 | 2.47 |
| Commodity | 0.58 | 15.67 | 16.07 | 8.43 |
| Brent crude oil | -2.36 | 13.36 | 7.57 | 5.74 |
| Energy | 0.59 | 25.60 | 22.98 | 7.61 |
| Bitcoin | -12.78 | 103.55 | 25.34 | 40.73 |
Source: Morningstar as of 30 June 2024. Total Returns in GBP. Global REITS: FTSE EPRA Nareit Developed, UK REITs: FTSE EPRA Nareit UK, Gold: LBMA Gold Price AM, Oil: Oil Price Brent Crude, Global Infrastructure: S&P Global Infrastructure, Natural Resources: S&P Global Natural Resources, Commodities: S&P GSCI , Energy : S&P GSCI,Volatility: CBOE Market Volatility (VIX), Cash: ICE LIBOR 1 Month, Bitcoin: MarketVector Bitcoin
Most-traded shares on the ii platform in Q2 2024
Most-bought shares
| NVIDIA Corp (NASDAQ:NVDA) |
| Legal & General Group (LSE:LGEN) |
| Rolls-Royce Holdings (LSE:RR.) |
| Tesla Inc (NASDAQ:TSLA) |
| Lloyds Banking Group (LSE:LLOY) |
Most-sold shares
These articles are provided for information purposes only. Occasionally, an opinion about whether to buy or sell a specific investment may be provided by third parties. The content is not intended to be a personal recommendation to buy or sell any financial instrument or product, or to adopt any investment strategy as it is not provided based on an assessment of your investing knowledge and experience, your financial situation or your investment objectives. The value of your investments, and the income derived from them, may go down as well as up. You may not get back all the money that you invest. The investments referred to in this article may not be suitable for all investors, and if in doubt, an investor should seek advice from a qualified investment adviser.
Full performance can be found on the company or index summary page on the interactive investor website. Simply click on the company's or index name highlighted in the article.
Editor's Picks