Stockwatch: onwards and upwards for L&G, Aviva and Admiral?
Analyst Edmond Jackson considers the substance behind this insurance trio’s remarkable 2025 rally.
15th August 2025 12:30

A surprise aspect of the 2025 rally in financial shares is insurers joining the party. For many years, investors learned – often the hard way – that this sector is typically priced for attractive yield given a lack of growth prospects.
Market setbacks would see shares fall due to the effect on portfolios of financial assets held to match short- and long-term liabilities, where life insurance and pensions are involved. Given that the industry is highly competitive – a plethora of online start-ups challenging big names with lower costs – it has become tricky to raise premiums at renewal time without a price-comparison website luring customers away.
- Invest with ii: Top UK Shares | Share Tips & Ideas | Open a Trading Account
Thirty years or so ago, a start-up called Independent Insurance became feted as a growth share, its CEO proclaiming over the extent of hours worked. It blew up, however, after accounting irregularities were exposed. Then Direct Line similarly captured attention and did genuinely innovate; but became a victim of competition, hence a superficially attractive high yield offset by an unreliable narrative and numbers.
With Legal & General Group (LSE:LGEN) exemplifying a sideways-volatile chart over a decade, and an 8.5% prospective yield at 263p currently, with highly complex accounts, some investors draw the line at saying that it is impossible to guard against liabilities manifesting.
Aviva charges out of its historic murk
This major FTSE 100 insurer Aviva (LSE:AV.) never properly recovered from the 2008 crisis when it fell from around 750p in 2007 to an early 2009 low near 200p. It traded sideways on a circa 8% yield similar to Legal & General, often sensitive to market volatility.
In 2025, however, its shares have risen nearly 40% to 675p softening its prospective yield to 6% as the CEO since 2020 is feted for actions maturing into results. Investors who held their nerve that the late 2024 takeover of Direct Line would be affirmed by regulators, have been rewarded by the market expectation of synergies arising.
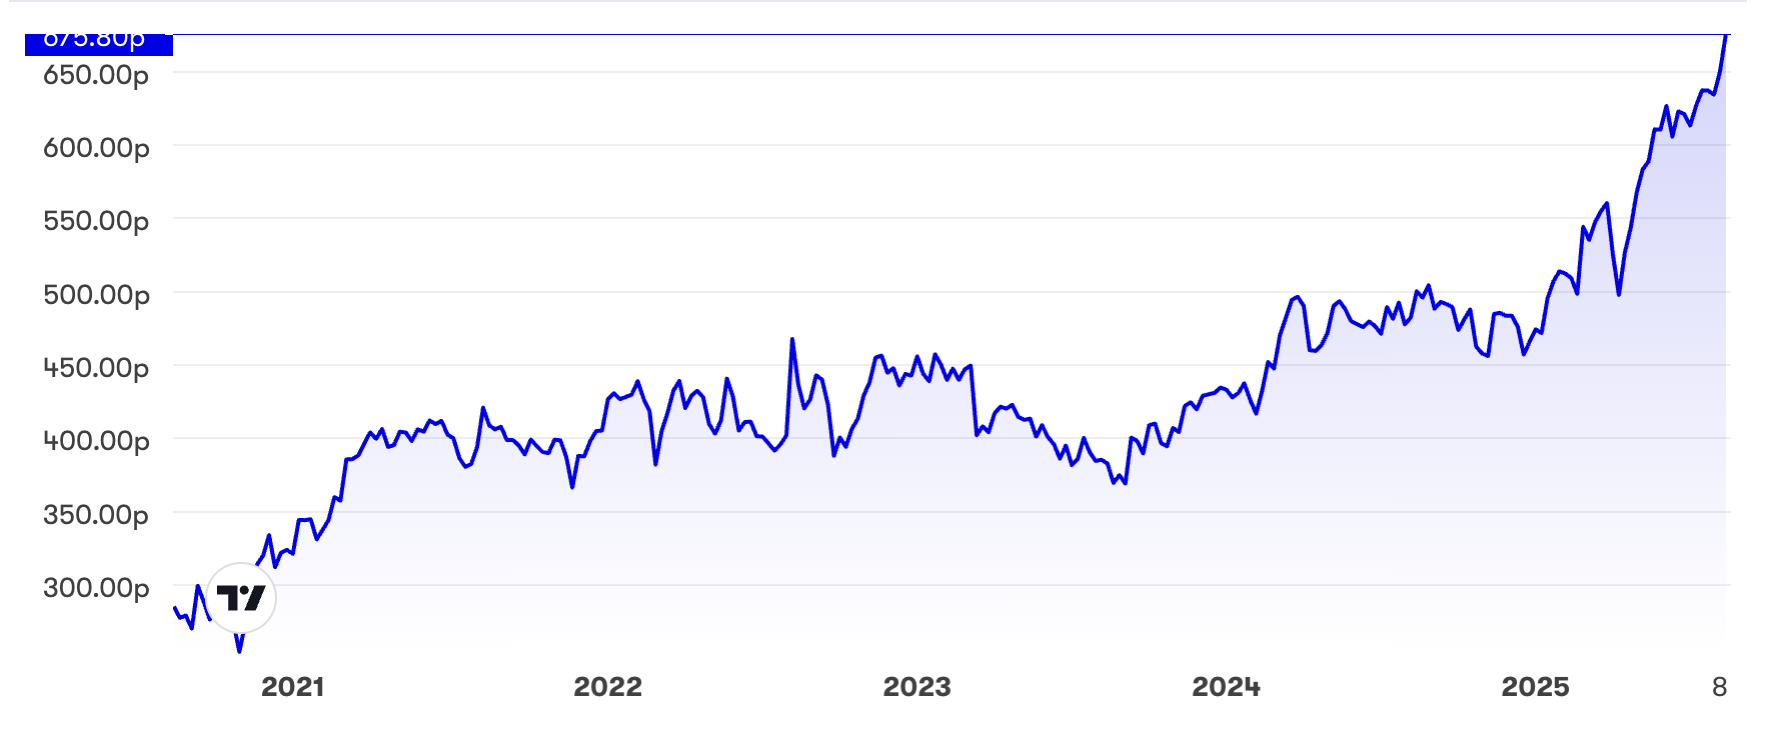
Source: interactive investor. Past performance is not a guide to future performance.
A remarkable aspect of the latest interim results, however, is CEO Amanda Blanc proclaiming it a growth company which, if fair, implies that the re-rating has further to go.
“Underpinning these results is growth right across our powerful, diversified business model,” she said, with general insurance operating profit up 29% and premiums by 7% even before Direct Line “opens up significant opportunities for growth” (rather than simply taking out cost) and within an overall 22% rise in group operating profit.
Versus asset manager shares typically dogged by net outflows, Aviva proclaims net flows up 16% on its wealth side with over £200 billion assets. Protection insurance is seeing improved margins as an acquisition is integrated and retirement services has seen £2 billion volumes at attractive margins despite higher competition in bulk annuities.
“There’s no shortage of opportunities across all our capital-light business and we have clear plans in place to go after them,” said Blanc. With greater scale than most banks in financial services and the Direct Line acquisition meaning that four in 10 adults have a policy with Aviva “this is a huge growth opportunity we’re uniquely positioned to unlock”.
- Aviva going from strength to strength with profit rise and dividend hike
- Watch our video: why UK shares can keep rising despite weak economy
The income statement on page 48 does, however, remind one of financial dynamics buffeting a respectable 17% increase in the insurance service’s result to £1,052 million. Despite a near 30% fall in investment return to £8,505 million, also a jump in net finance expense from insurance contracts to £2,213 million from £205 million, interim group pre-tax profit is rescued by a reduction in the “movement in non-participating investment contract liabilities” from £10,621 million to £5,318 million.
Yes, there is a 30% hike in pre-tax profit to £1,267 million and by 25% to £819 million net, but the outcome could so easily have been swung either way by variables it is very hard to get a handle on.
Also net cash generation from operations has changed adversely from £712 million to £3,125m absorbed in the first half of 2025. This is admittedly a snapshot and where the financing side of the cash flow statement shows a 50% reduction in net cash used plus an increase in end-2024 cash helping the 30 June cash position up 13% to £18,751 million on 2024.
Aviva - financial summary
Year-end 31 Dec
| 2016 | 2017 | 2018 | 2019 | 2020 | 2021 | 2022 | 2023 | 2024 | |
| Operating profit (£m) | 1,833 | 2,374 | 1,734 | 4,374 | 1,972 | 1,069 | -2,998 | 1,884 | 1,661 |
| Net profit (£m) | 703 | 1,497 | 1,568 | 2,548 | 2,798 | 1,966 | -1,051 | 1,085 | 684 |
| Reported EPS (p) | 19.9 | 45.0 | 49.7 | 82.4 | 43.7 | 8.3 | -34.7 | 37.7 | 23.3 |
| Normalised EPS (p) | 23.6 | 46.6 | 48.0 | 82.4 | 43.7 | 8.3 | -34.7 | 37.7 | 23.3 |
| Return on total capital (%) | 0.4 | 0.5 | 0.4 | 1.0 | 0.4 | 0.3 | -1.0 | 0.6 | 0.5 |
| Operating cashflow/share (p) | 153 | 249 | 177 | 200 | -82.8 | 7.4 | 508 | -99.6 | 311 |
| Capex/share (p) | 6.0 | 5.7 | 5.0 | 4.0 | 4.6 | 3.6 | 3.2 | 12.8 | 6.4 |
| Free cashflow/share (p) | 147 | 243 | 172 | 196 | -87.4 | 3.8 | 505 | -112 | 305 |
| Dividend per share (p) | 30.7 | 36.1 | 39.5 | 20.4 | 27.6 | 29.0 | 31.0 | 33.4 | 35.7 |
| Covered by earnings (x) | 0.6 | 1.3 | 1.3 | 4.0 | 1.6 | 0.3 | -1.1 | 1.1 | 0.7 |
| Cash (£m) | 29,834 | 13,377 | 8,355 | 11,171 | 10,345 | 12,485 | 22,505 | 17,273 | 23,481 |
| Net debt (£m) | -17,858 | -2,360 | 2,359 | -190 | 780 | -5,141 | -14,435 | -9,906 | -16,595 |
| Net assets (£m) | 16,803 | 16,969 | 16,558 | 17,008 | 19,354 | 16,238 | 9,704 | 9,082 | 8,105 |
| Net assets/share (p) | 544 | 557 | 559 | 571 | 649 | 569 | 348 | 334 | 305 |
Source: historic company REFS and company accounts
With consensus at £1,516 million net profit this year and £1,800 million in 2026, for earnings per share (EPS) of 50.3p and 58.2p respectively, the 12-months’ forward price to earnings (P/E) is around 12.5x, but such is the expected earnings dynamic, that Aviva remarkably “qualifies” of sorts for the price/earnings-to-growth (PEG) ratio, where 0.8 rates attractive, below 1.0.
Part of this share’s rally looks to involve a sense that Aviva is morphing from a classic high-yield “value” share to “growth” – remarkable for a £20 billion FTSE 100 company. However, bear in mind the inherent fluctuations in the insurance industry, also these major financial dynamics that can buffet annual outcomes.
I did, however, rate Aviva a “buy” at 470p in June 2024 when it was possible to lock in an 8% prospective yield for 2025, also at 342p in March 2020 when markets were clobbered by Covid. The rationale back then was chiefly that Aviva was “one of the best UK shares for income, which will eventually kick in to support price”. Now that it has broken out of its 10-plus years’ trading range, regaining a level last seen in late 2007, more attention needs paying to earnings, but mind that these are liable to be volatile – even if a capable CEO mitigates that.
This may be over-cautious but I incline to temper to “hold” given a 6% yield looks about right for overall risks in insurance, plus the possibility that profit swings may be unavoidable.
Legal & General also participating in the rally
At 263p, Legal & General Group (LSE:LGEN) remains [in the] median [part of] its 10-year range and below 300p attained in early 2020, also 2022, and yields 8.4% covered just over 1x if consensus is fair.
Yet if buying around 220p last November, also last April in the US tariffs-driven market sell-off, it was possible to lock in nearly a 10% yield besides 20% upside.
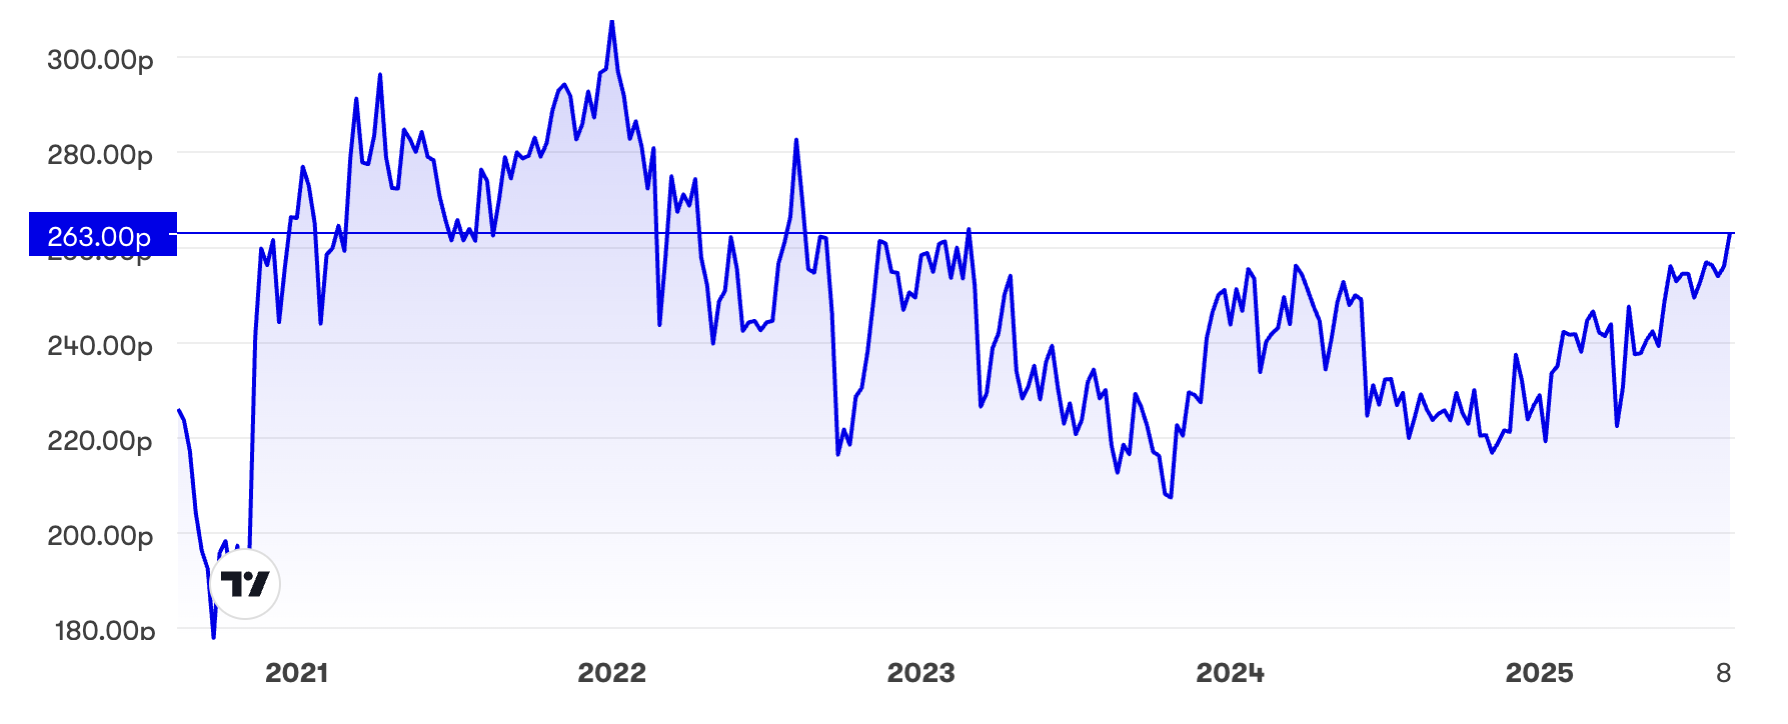
Source: interactive investor. Past performance is not a guide to future performance.
I made a “buy” case at 227p around the same time as Aviva in June 2024, on a rationale that a 9% yield, as expected then, was excessive for the risks, hence a mean-reversion was due. The time involved shows the patience required when the market seeks reasonable proof of a status change.
Interestingly, Legal & General’s global monitor report for “pension risk transfer” (PRT) predicts that the UK market in PRT will see inflows of over £500 billion between 2029 and 2043 – marking a “transformative period”. Despite a slower start to the year, volumes for 2025 are expected to be consistent with industry projections of up to £50 billion for the third year in a row.
- A punchy performance from high-yielding Legal & General
- ‘Rare’ opportunity to buy this FTSE 100 stalwart?
Possibly this helps to support consensus projections for a big increase in profit and earnings this year, also 14% earnings per share growth in 2026 to 25p based on £1,470 million net profit. It would still only imply 1.1x cover for a 22p dividend, which has been uncovered since 2022, albeit massively supported by the cash balance.
Management thinks PRT could present “a significant opportunity” for the sector to drive global economic growth by supporting companies to de-risk their balance sheets and focus on core businesses, while delivering long-term financial security to their pensioners. “There is £1 trillion in global opportunities,” it says.
While Aviva currently appears to have a uniquely capable CEO, given that L&G’s yield is still over 8% versus 6% for Aviva, and if this positive industry scenario manifests, I retain a “buy” stance.
Profits’ surge manifests at Admiral
Besides Aviva, another remarkable set of interims is from Admiral Group (LSE:ADM), an £11 billion FTSE 100 company delivering a 69% leap in continuing operations’ pre-tax profit to £521 million, helping earnings per share up 72% to 132.5p. Group revenue was flat at £3.1 billion, however, despite insurance revenue up 18% near £2.5 billion. A rise of over 10% in group customers to 11.4 million was also commendable.
The shares understandably rose 6% given this surprise, holding at around 3,575p. Again, we see a sharp bull trend in 2025, although like L&G, Admiral is essentially at the top of its medium-term range rather than truly breaking out:
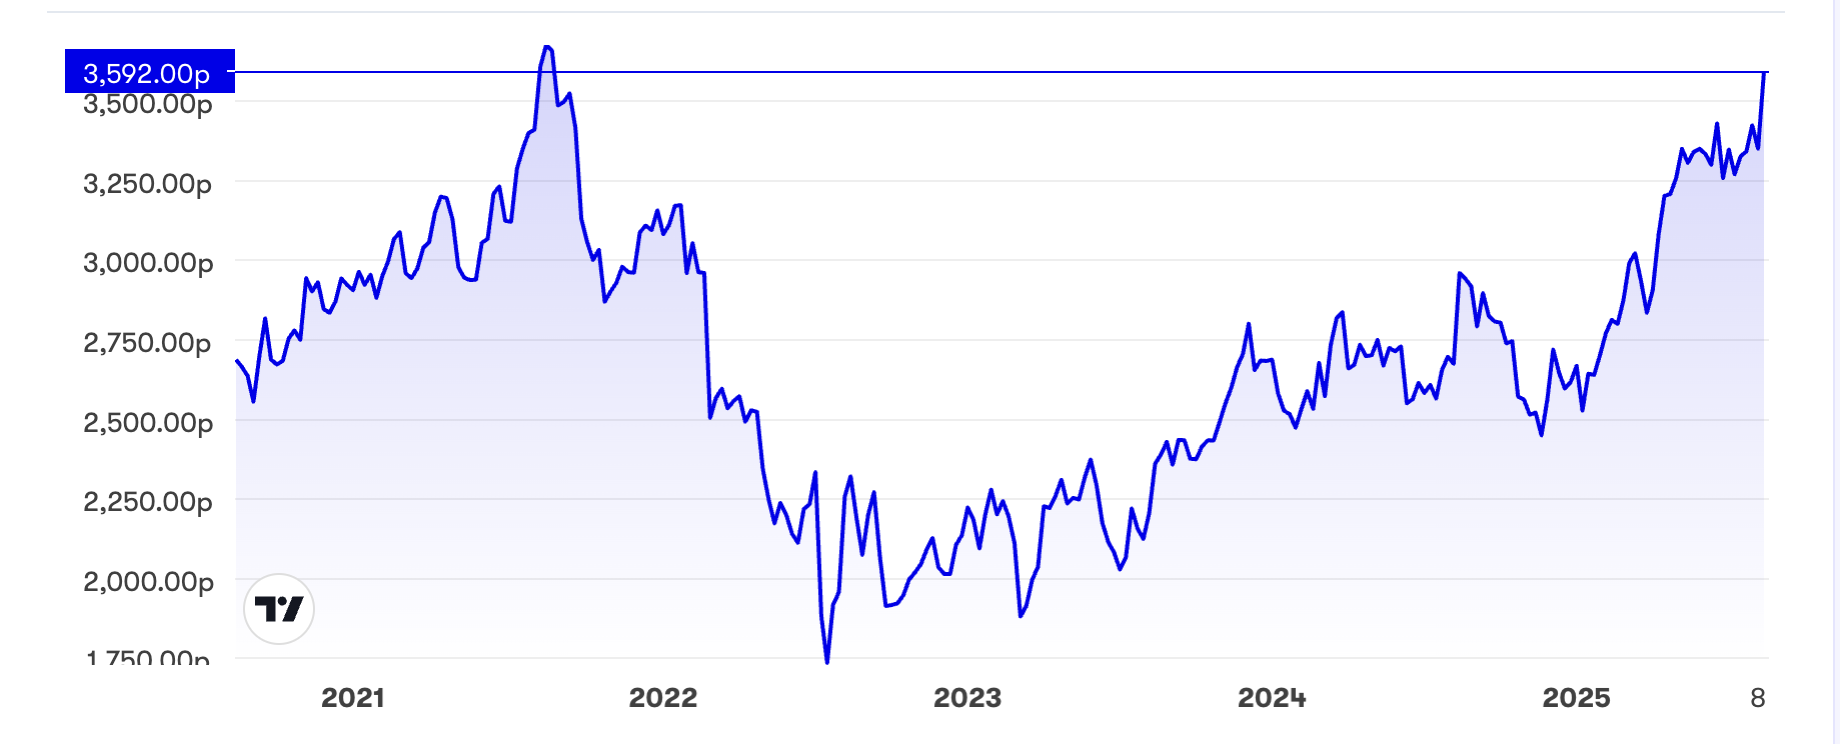
Source: interactive investor. Past performance is not a guide to future performance.
Admiral’s profits’ surge seems all the more remarkable given a softening in the UK motor insurance market over the last 18 months, with its motor side enjoying a 56% jump in pre-tax profit to £559 million on a 5% increase in UK vehicles insured. However, this reflects 2023 price rises which have taken 12 to 18 months to work through.
The smaller household insurance side doubled profit to £25 million and travel/pets recovered from a near £7 million loss into slight profitability. Also Admiral Money enjoyed a 139% profits leap over £16 million, albeit helped by a part-sale of the loan book.
- ii view: income play Admiral drives better than expected profits
- FTSE 100 insurer slides despite profit beat
Admiral is another example of UK insurance and money doing well, in a context where the benchmark expectation would be “challenging” given a so-called cost-of-living crisis forcing people into the arms of discount operators.
It shows how most people, perhaps, are well-insulated by pay rises, and hence may not need to shop around at insurance renewal times, and have spare capital.
I haven’t covered Admiral since it was 875p in March 2012, when I drew attention to directors and their wives’ buying. That anyone can suggest to their spouse that a substantial buy is a good idea – the CEO’s wife had bought a million at 874p – seems to me quite a margin of safety.
Interestingly, Admiral back then was on a near 6% prospective yield, just like it is now. If interim net profit is repeated, then 2025 profit would be £800 million rather than the £722 million consensus, although we may have to adjust the medium term for this exceptional boost from motor lately.
At 3,575p, the shares trade possibly on a P/E around 14x vs Aviva on 12.5x, which may be rich if valuing chiefly on earnings, but with a near 6% yield covered 1.1x, I take a “hold” stance.
Edmond Jackson is a freelance contributor and not a direct employee of interactive investor.
These articles are provided for information purposes only. Occasionally, an opinion about whether to buy or sell a specific investment may be provided by third parties. The content is not intended to be a personal recommendation to buy or sell any financial instrument or product, or to adopt any investment strategy as it is not provided based on an assessment of your investing knowledge and experience, your financial situation or your investment objectives. The value of your investments, and the income derived from them, may go down as well as up. You may not get back all the money that you invest. The investments referred to in this article may not be suitable for all investors, and if in doubt, an investor should seek advice from a qualified investment adviser.
Full performance can be found on the company or index summary page on the interactive investor website. Simply click on the company's or index name highlighted in the article.
Disclosure
We use a combination of fundamental and technical analysis in forming our view as to the valuation and prospects of an investment. Where relevant we have set out those particular matters we think are important in the above article, but further detail can be found here.
Please note that our article on this investment should not be considered to be a regular publication.
Details of all recommendations issued by ii during the previous 12-month period can be found here.
ii adheres to a strict code of conduct. Contributors may hold shares or have other interests in companies included in these portfolios, which could create a conflict of interests. Contributors intending to write about any financial instruments in which they have an interest are required to disclose such interest to ii and in the article itself. ii will at all times consider whether such interest impairs the objectivity of the recommendation.
In addition, individuals involved in the production of investment articles are subject to a personal account dealing restriction, which prevents them from placing a transaction in the specified instrument(s) for a period before and for five working days after such publication. This is to avoid personal interests conflicting with the interests of the recipients of those investment articles.
Editor's Picks