US funds are rallying, while China funds pause for breath
In the latest weekly update Saltydog Investor notes that as well as China funds being in fine form, the top three funds from the North America sector have gone up by over 6% in the last four weeks.
14th October 2024 12:37

This content is provided by Saltydog Investor. It is a third-party supplier and not part of interactive investor. It is provided for information only and does not constitute a personal recommendation.
This year, we have seen numerous stock market indices reaching new all-time highs, but we have also seen some significant falls.
In February, the Japanese Nikkei 225 finally surpassed its previous all-time high, which was set in December 1989, and in early March it ended the day above 40,000 for the first time. It peaked in July at 42,224.
The FTSE 100, which had briefly closed above 8,000 a couple of times in February 2023, did not get back there again until April of this year, but has remained above that level ever since. In May, it finished the day at 8,446, currently its highest closing figure. The French CAC 40 also set a record high on the same day, which it still has not beaten.
Invest with ii: Buy Global Funds | Top Investment Funds | What is a Managed ISA?
The Indian Sensex broke through 80,000 in July, and got as high as 85,836 towards the end of September.
However, it has not all been good news. This year we have also seen some significant falls. At the beginning of August there was a sudden sell-off in global equity markets. A disappointing July jobs report in the US raised fears of a recession, and interest rates rising in Japan led to the unwinding of the yen carry trade.
After the first two trading sessions, the FTSE 100 was down 4.3%, and the FTSE 250 had lost 6.3%. Other European indices had fallen by similar amounts. In the US, the Dow Jones Industrial average had fallen by 5.2%, the S&P 500 was down 6.1%, and the Nasdaq was showing a loss of 8.0%. On 5 August the Japanese Nikkei 225 suffered its largest ever one-day loss, falling by 12.4%.
The situation improved during the month, but it was a stark reminder of how quickly markets can fall when sentiment changes.
September followed a similar pattern. Although the initial falls were not as dramatic as in August, they were still significant. At one stage, all of the stock market indices that we track were showing losses but, once again, by the end of the month most had recovered.
Probably the biggest surprise has been the recent rally in the Chinese stock markets.
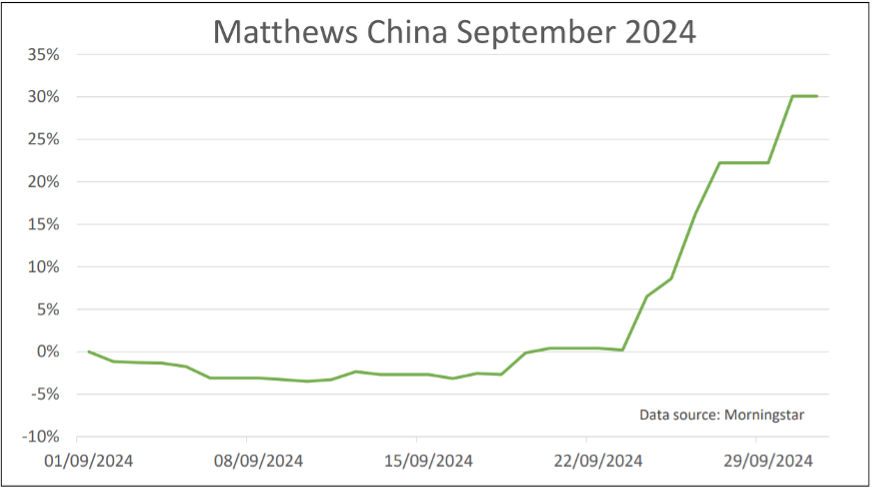
At the end of the second week of September the Shanghai Composite was showing a month-to-date loss of 4.9%, and it had fallen by 9.1% since the beginning of the year. On 24th September, Pan Gongsheng, the Governor of the People's Bank of China, unveiled its most significant set of economic stimulus measures since the onset of the Covid-19 pandemic. The Chinese stock markets rallied and by the end of the month the Shanghai Composite was up 17.4%. On the last day of the month it rose by 8.1%, one of its largest ever one-day gains.
Last week, I produced a graph of the Matthews China fund showing its performance up until the end of September. Here it is again.

Past performance is not a guide to future performance.
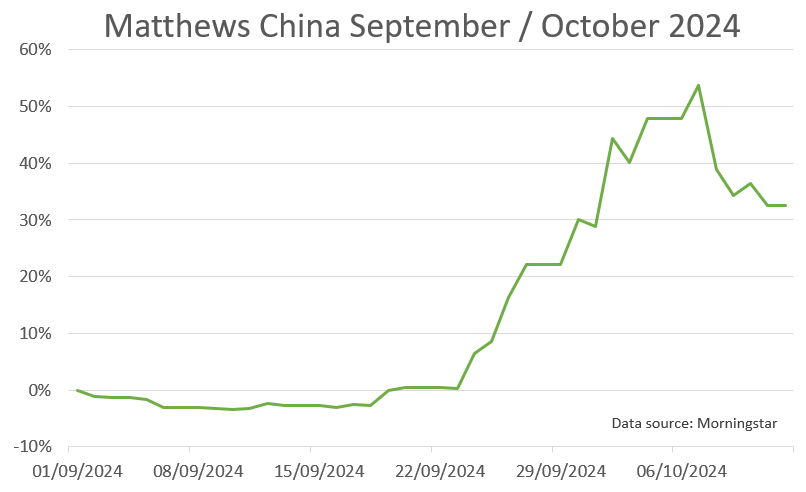
An impressive rise, by any standards, but we were concerned that it was unsustainable. The Chinese markets were closed for the first week of October for their ‘Golden Week’ holiday, and only opened again last Tuesday. Initially they went up, but by the end of the week had fallen. The Shanghai Composite ended the week showing a month-to-date loss of 3.6%. The Mathews China fund fell by even more.

Past performance is not a guide to future performance.
In the US, the Dow Jones Industrial Average closed above 40,000 for the first time in May and has consistently traded above this figure in recent months. However, as I have already mentioned, it did fall by 5.2% at the beginning of August. It rallied during the month, but then lost 2.9% at the beginning of September. It has subsequently recovered, and last week finished at an all-time high of 42,864.
The North America sector was one of the best-performing sectors in the first quarter of this year, with a three-month return of 10.8%. The only sector that did better was Technology & Technology Innovation, which made a gain of 11.0%. The second quarter was less impressive, but it still went up by 1.7%. The third quarter was even worse. It went down by 0.1%. So far this month, the leading sector is Technology & Technology Innovation, up 4.0%. Then it is North America, which has risen by 3.1%.
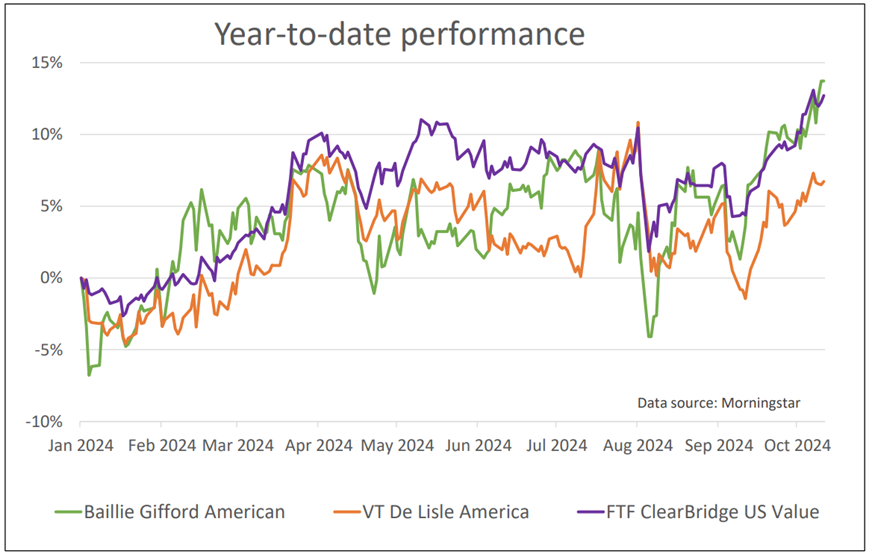
The top three funds from the North America sector have gone up by over 6% in the last four weeks. This is how they have performed so far this year.

Past performance is not a guide to future performance.
After a good start, they did not do much in May, June and July. They then fell at the beginning of August and again at the beginning of September, but have since recovered. The Baillie Gifford American and FTF ClearBridge US Value funds have recently set new one-year highs.
For more information about Saltydog, or to take the two-month free trial, go to www.saltydoginvestor.com
These articles are provided for information purposes only. Occasionally, an opinion about whether to buy or sell a specific investment may be provided by third parties. The content is not intended to be a personal recommendation to buy or sell any financial instrument or product, or to adopt any investment strategy as it is not provided based on an assessment of your investing knowledge and experience, your financial situation or your investment objectives. The value of your investments, and the income derived from them, may go down as well as up. You may not get back all the money that you invest. The investments referred to in this article may not be suitable for all investors, and if in doubt, an investor should seek advice from a qualified investment adviser.
Full performance can be found on the company or index summary page on the interactive investor website. Simply click on the company's or index name highlighted in the article.
Editor's Picks