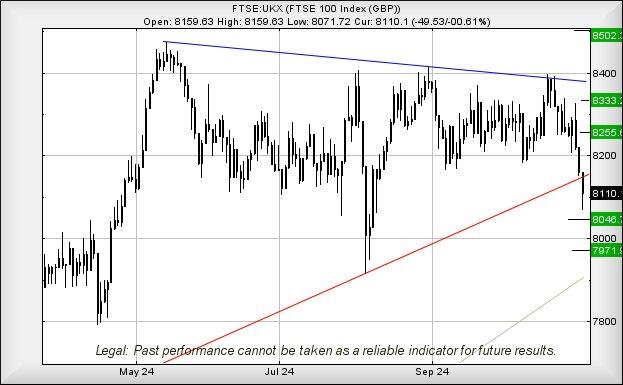
FTSE for Friday: what does this trend break mean for FTSE 100?
After a lurch lower yesterday which took the blue-chip index below a key trend line, independent analyst Alistair Strang has another look at the chart. Here's what it means for UK investors.
1st November 2024 07:43

The FTSE 100 appears to have broken a trend, and not in a good way. The UK’s recent budget would be easy to blame for the market decline but, at best, we can only guess the markets are flopping around as due to US election fever, the markets completely failing to know how to react from one day to the next.
- Invest with ii: Open a Stocks & Shares ISA | ISA Investment Ideas | Transfer a Stocks & Shares ISA
on Thursday, with CNN producing large swings for Harris at the obvious expense of Trump, markets everywhere had an excuse for a decline. The Dow Jones, for instance, finished the session at 41,763 and in a zone where the next few days points to a potential bottom of 40,600 points, a nice tidy 1,000+ point gift across the next few sessions.
The only problem is there’s a US Presidential election blocking the path, promising to make the 5 November fireworks quite spectacular, while the real thing breaks out across the pond.
The FTSE appears to have joined world markets in being nervous about North America, and there’s still time for a surprise recovery before a painful plunge. From our perspective, any surprise recovery requires to exceed 8,150 to derail a drop to 8,046 and a fake bounce but, should 8,046 break, we shall anticipate the UK experiencing a bottom at an eventual 7,971 points and a bounce.
In this scenario, it looks possible a stop loss level at 8,150 shall prove sane, if we work on the basis some sort of fake short term bounce is ahead.
Of course, the question must be asked of what to expect, should 8,150 be exceeded?
In such a scenario, we can calculate the potential of a lift to an initial 8,255 points with our secondary, if bettered, at 8,333 points. Overall, this dumps the UK index in a zone where an eventual breakout to 8,502 points becomes possible.

Source: Trends and Targets. Past performance is not a guide to future performance.
Alistair Strang has led high-profile and "top secret" software projects since the late 1970s and won the original John Logie Baird Award for inventors and innovators. After the financial crash, he wanted to know "how it worked" with a view to mimicking existing trading formulas and predicting what was coming next. His results speak for themselves as he continually refines the methodology.
Alistair Strang is a freelance contributor and not a direct employee of Interactive Investor. All correspondence is with Alistair Strang, who for these purposes is deemed a third-party supplier. Buying, selling and investing in shares is not without risk. Market and company movement will affect your performance and you may get back less than you invest. Neither Alistair Strang or Interactive Investor will be responsible for any losses that may be incurred as a result of following a trading idea.
These articles are provided for information purposes only. Occasionally, an opinion about whether to buy or sell a specific investment may be provided by third parties. The content is not intended to be a personal recommendation to buy or sell any financial instrument or product, or to adopt any investment strategy as it is not provided based on an assessment of your investing knowledge and experience, your financial situation or your investment objectives. The value of your investments, and the income derived from them, may go down as well as up. You may not get back all the money that you invest. The investments referred to in this article may not be suitable for all investors, and if in doubt, an investor should seek advice from a qualified investment adviser.
Full performance can be found on the company or index summary page on the interactive investor website. Simply click on the company's or index name highlighted in the article.
Editor's Picks