What's the best strategy when investing cash?
With equity markets at or near highs, investors earning little interest on cash face a conundrum.
12th November 2019 12:39
With equity markets at or near highs, investors earning little interest on cash face a conundrum.

Is now a good time to put cash to work, especially as some investment analysts are warning that the stock market is ripe for a correction?
Given that no one can predict with certainty where stock markets will head next, is the best strategy to invest cash all in one lump sum or at regular intervals? If it's the latter should you drip in monthly, quarterly or even yearly? Is it better to drip in over a longer period of time or a shorter one?
To shed some light on this let's imagine a couple of extreme scenarios.
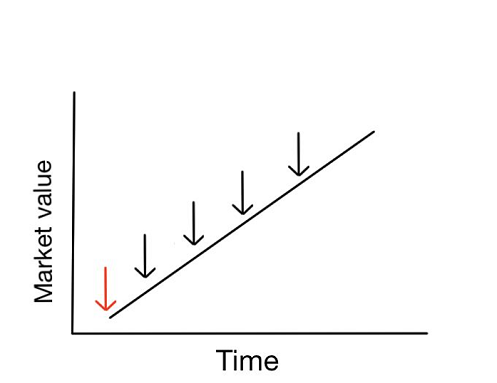
In the first scenario we'll assume that stock markets go up in a straight line, as shown below. The red arrow is the point when a lump sum investor would invest all their money in one go, while the black arrows are when a regular investor invests equal-sized portions of their cash.
Scenario 1

For the lump sum investor, all of their money has been exposed to the market rally after they invested. For the regular investor, each subsequent instalment of money which they dripped in has been exposed to less and less of the market rally.
This means that the regular investor has made less profit than the lump sum investor. Clearly in this scenario lump sum investing wins.
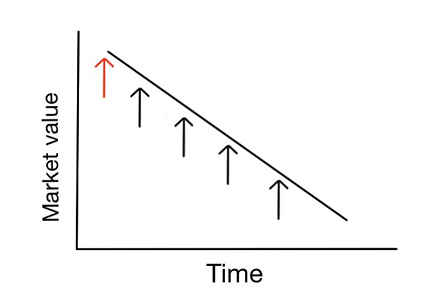
In our second scenario let's assume that markets always fall in a straight line. For the regular investor each dripped instalment loses less and less as the market falls. Whereas all of the lump sum investor's money (the red arrow) is exposed to the full market sell-off.
The regular investor would win in this scenario. Furthermore, the regular investor will make more profit if the market rebounds back to where it started. In this scenario the regular investor is taking advantage of what is known as 'pound cost averaging'.

Of course, real markets don't move in a straight line, so let's consider two historical examples of market collapses from all-time highs that echo exactly what nervous investors fear a repeat of today.
The worst five-year time frame for investing
One of the worst five year periods for investing in recent memory was the five-year period after the dotcom bubble high on 30th December 1999. Over the next five years the FTSE 100 lost a total of 30.45%.
The table below shows the returns an investor in a FTSE 100 tracker would have enjoyed using a range of investment strategies. In each case a total of £12,000 was invested.
| Investment strategy | Total invested | Final value |
|---|---|---|
| £12k at start | £12,000 | £9,668 |
| £2,400 a year | £12,000 | £12,370 |
| £600 every quarter | £12,000 | £12,884 |
| £200 per month | £12,000 | £12,827 |
The benefit of regular investing vs lump sum investing is plain to see. The lump strategy produced a loss of nearly 20% versus a profit of 7% from dripping money in monthly or quarterly.
What about a longer time frame?
One of the worst ten year periods for equity investors started just before the dotcom bubble burst. From the 4th March 1999 to 4th March 2009 the FTSE 100 (including reinvested dividends) made a loss of 17.79%
The table below again shows how each strategy fared between 4th March 1999 and 4th March 2009.
| Investment strategy | Total invested | Final value |
|---|---|---|
| £12k at start | £12,000 | £9,865 |
| £1,200 a year | £12,000 | £9,995 |
| £300 every quarter | £12,000 | £9,892 |
| £100 per month | £12,000 | £9,921 |
Regular investing was the best strategy but the outperformance was only marginal given the timescales involved.
Interestingly, if you continue extending the time frame over which you invest/drip money in to the market the odds of the lump sum investor winning keep increasing until it is actually the most likely outcome.
It's more about time than timing
For nervous investors with shorter investment time frames looking to enter the market now, regular investing still makes sense. As does reducing the frequency of any regular investing to either monthly or quarterly as opposed to annually.
But the more historical scenarios you run the more it becomes apparent that a range of factors determine which strategy is ultimately successful including the price you bought at, the frequency of your investment and the market environment.
Yet the biggest factor determining which strategy is most profitable is your investment time frame, especially if the stock market collapses.
The shorter the time frame the less time a lump sum investment has to recover from a severe market fall. As your investment time frame starts to increase the benefits of dripping are quickly eclipsed by the benefits of time in the market, thanks to the power of compounding.
What this means is that investors deciding how to deploy cash shouldn't just be pondering whether markets are more likely to fall or rise from here but also their investment time frame.
Damien Fahy is founder of Money to the Masses.
Full performance can be found on the company or index summary page on the interactive investor website. Simply click on the company's or index name highlighted in the article.
This article was originally published in our sister magazine Moneywise, which ceased publication in August 2020.
These articles are provided for information purposes only. Occasionally, an opinion about whether to buy or sell a specific investment may be provided by third parties. The content is not intended to be a personal recommendation to buy or sell any financial instrument or product, or to adopt any investment strategy as it is not provided based on an assessment of your investing knowledge and experience, your financial situation or your investment objectives. The value of your investments, and the income derived from them, may go down as well as up. You may not get back all the money that you invest. The investments referred to in this article may not be suitable for all investors, and if in doubt, an investor should seek advice from a qualified investment adviser.
Full performance can be found on the company or index summary page on the interactive investor website. Simply click on the company's or index name highlighted in the article.
Editor's Picks